The Opioid Crisis: Using Data
March 12, 2018 •Olivia Hebner

In the second post of this blog series, we discuss a few ways data management and statistical analysis can be useful to opioid litigation.
With so many cases involved in the opioid crisis, keeping track of the case information alone will be a data management challenge. Further, organizing and analyzing the various data files from health care institutions, pharmaceutical manufacturers, distributors, pharmacies, the Drug Enforcement Administration (DEA), and other sources will be a massive undertaking. At Summit, we specialize in combining large, messy datasets into formats that are easy to analyze. For example, the Summit team downloaded and formatted multiple reports from a PDF file into a CSV file from the Automation of Reports and Consolidated Orders System (ARCOS) into a usable format using statistical software. The DEA is going to provide ARCOS data on opioids from 2006 through 2014 to the court for the national multi-district litigation case, according to this article. Read more about data organization and structure here.
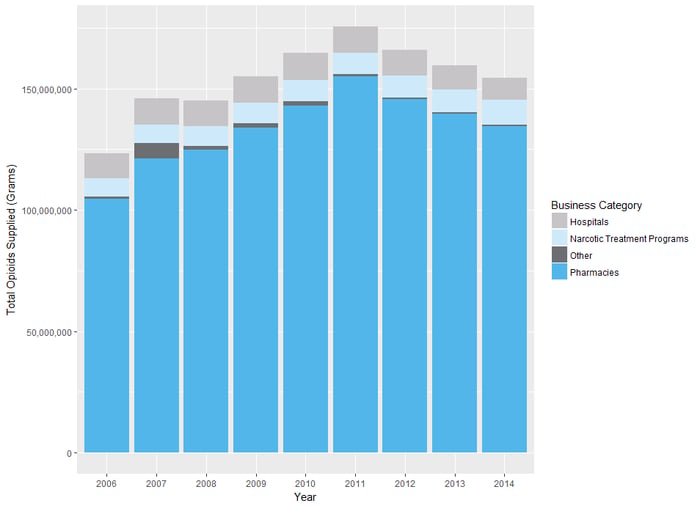
Once the data are organized, there are many options for analyzing the data to support the arguments in these cases. For example, the dataset we formatted from ARCOS can easily be used to create Figure 1 to demonstrate total opioids supplied in the United States from 2006 through 2014.
Figure 1: Total Opioids Supplied (Grams) in the United States by Year

Note: “Other” includes practitioners, mid-level practitioners and teaching institutions. Data were downloaded from the ARCOS Retail Drug Summary Report 7 for the years 2006 -2014 (https://www.deadiversion.usdoj.gov/arcos/retail_drug_summary/).
Other statistical and econometric approaches beyond data visualization, like sampling and regression, can be used to analyze the data and support arguments. One area of interest might be opioid distribution by pharmacy. Analyzing every pharmacy’s data, even in one area, could take a lot of time and effort. Reduction of the analytical burden is possible using a statistical sample of pharmacies. A statistical sample is much more cost effective and still allows for drawing valid conclusions about the population. Learn more about the advantages of statistical sampling here.
Regression is a powerful tool to control for the factors that might contribute to opioid distribution (e.g., size or age of the population). Statisticians use regression models to predict and explain an outcome while isolating the contributing factors. For example, a regression could explain what the opioid distribution should be in an area with an aging population while holding all other contributing factors constant. Learn more about the advantages of regression analysis here.
Summit’s Litigation Analytics team specializes in supporting counsel and expert witnesses in various matters involving data and analytics. If you’re interested in how Summit can support you and your team, please contact Corey West at corey.west@summitllc.us.
Get Updates
Featured Articles
Categories
- affordable housing (12)
- agile (3)
- AI (4)
- budget (3)
- change management (1)
- climate resilience (5)
- cloud computing (2)
- company announcements (15)
- consumer protection (3)
- COVID-19 (7)
- data analytics (82)
- data science (1)
- executive branch (4)
- fair lending (13)
- federal credit (36)
- federal finance (7)
- federal loans (7)
- federal register (2)
- financial institutions (1)
- Form 5500 (5)
- grants (1)
- healthcare (17)
- impact investing (12)
- infrastructure (13)
- LIBOR (4)
- litigation (8)
- machine learning (2)
- mechanical turk (3)
- mission-oriented finance (7)
- modeling (9)
- mortgage finance (10)
- office culture (26)
- opioid crisis (5)
- Opportunity Finance Network (4)
- opportunity zones (12)
- partnership (15)
- pay equity (5)
- predictive analytics (15)
- press coverage (3)
- program and business modernization (7)
- program evaluation (29)
- racial and social justice (8)
- real estate (2)
- risk management (10)
- rural communities (9)
- series - loan monitoring and AI (4)
- series - transforming federal lending (3)
- strength in numbers series (9)
- summer interns (7)
- taxes (7)
- thought leadership (4)
- white paper (15)


