October 13, 2014 •Brian Wong

 In the last post, we used data analytics to figure out that marketing Zombie Wars as a horror flick will give us the most bang for our buck. This time around we’ll do some analysis to determine the best release date for our aspiring blockbuster.
We thought it would make sense to compare movie profits during two of the biggest movie-going seasons: the holiday and summer seasons.
Ideally, we would like to compare apples to apples and only look at release trends for movies in the horror genre, but there were only seven horror movies released in 2013, and (shocker) none of those were released during the holiday season! This made it impossible to measure a holiday effect on horror movies and thus difficult to draw a conclusion about profitability. The best way to solve this sample size issue would be to collect more data on horror movies. However, in the spirit of realism, we cite time and resource constraints, and simply make an assumption that movies of all genres have similar profit distributions across time.
First, we examine the differences in total profit and profit percentage of movies released during the holiday and non-holiday seasons. The results are shown in the table below. We also test for statistical significance to determine whether any difference is due to random chance or an actual difference in the expected profits of movies released during the holiday season versus those released during any other time.
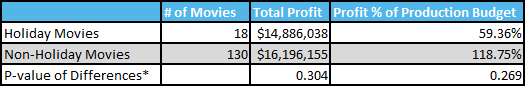
*Note: Used Mann-Whitney U Test due to non-normal distribution of each predictor
We can see that holiday movies typically rake in less profit and % profit than non-holiday movies, which may go against what one would intuitively think. However, this difference is not significant, as small sample sizes of holiday movies (18) may have contributed to this. Meanwhile, the results for movies released in the summer vs. non-summer season appear below:
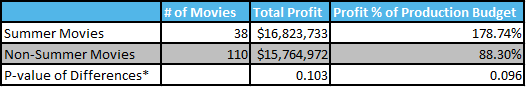
*Note: Used Mann-Whitney U Test due to non-normal distribution of each predictor
Since the sample is more balanced, detected differences in the total profit and profit percentage had more significance and a higher probability of being a true difference. While neither of our time criteria show a strong correlation with profits, it seems like a good idea to roll out our zombie horror movie in the summertime.
Next week, in the last post of this "statistics and movies" series, we’ll try to see if we can use predictive analytics to determine if a major Hollywood star can maintain his or her earning power in the future.
This post was written with the help of Sejla Karalic and Jon Carver.