February 18, 2015 •Shane Thompson
People care about cause and effect. If A, then B. Researchers know that the best way to measure causal effects – the experimental ideal – is through randomized controlled trials (RCTs). Researchers also know that RCTs used to study policies and programs are exceedingly rare, because they face at least two major challenges. First, RCTs are expensive and time-consuming to set up and conduct. Second, it may not be feasible or ethical to manipulate exposure to random assignment. This presents an all-too-common obstacle for researchers: how might non-experimental data be analyzed to produce cause-effect estimates?
Quasi-experimental designs (QEDs) address this problem. QEDs take non-experimental datasets and transform them into quasi-experimental datasets, effectively creating quasi-RCTs. QEDs identify treatment and control groups in datasets where they did not exist originally. The QED methods used to identify treatment and control groups are rigorously technical and statistically justifiable.
Consider, for example, a large administrative database for a public job-training program. The data are collected to track program characteristics (e.g. participant characteristics), services offered by the program, and program outcomes. Participants are not randomly assigned to the program and are not randomly assigned to specific services. Thus, there are no natural treatment or control groups, and the estimated effects of the program on participants would be biased. QEDs innovatively restructure, reorganize, and rethink the data to produce plausible treatment and control groups, and to estimate causal effects.
Two possible QEDs for such a dataset are Propensity Score Matching Methods and Synthetic Control Methods:
How it works:
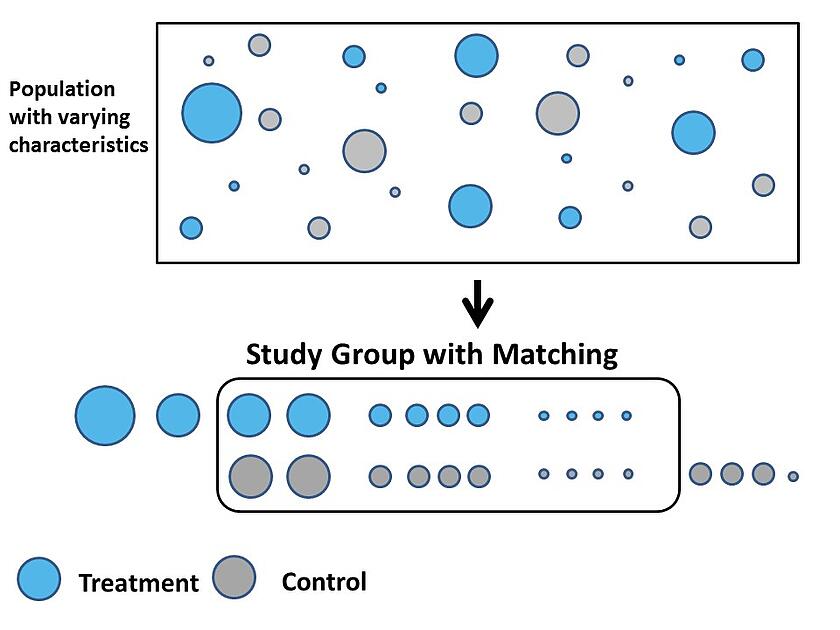
The treatment group and the donor pool of potential control groups are identified.
The outcome variable and its relevant predictor variables (that are available in the data) are specified.
The probability of being in the treatment group is estimated for each subject in the sample, given their observable characteristics.
Treatment groups and control groups are matched based upon their likelihood to receive the treatment.
The treatment effect is estimated as the difference between the treatment groups and their statistically-matched control groups.

Figure 1: Propensity Score Matching Methods
More on Propensity Score Matching can be found in the Program Evaluation portal.
How it works:
The treatment group and the donor pool of potential control groups are identified.
The outcome variable and its relevant predictor variables (that are available in the data) are specified.
A synthetic control group, which is a weighted combination of several control groups from the donor pool, is constructed to be approximately equal to the treatment group in the pre-treatment characteristics.
The treatment effect is estimated by the difference between the treatment group and the synthetic control group in the post-treatment period.

Figure 2: Synthetic Control Methods
The data explosion of the digital age has made more data available to more people than ever before. This is likely to continue, but traditional RCTs used to test policies and programs are likely to remain rare. Cutting edge evaluators, statisticians, and econometricians must be able to formulate sound QED methodologies to confront the non-experimental data they will inevitably analyze. The estimation of causal effects will be otherwise impossible.