Propensity Score Matching
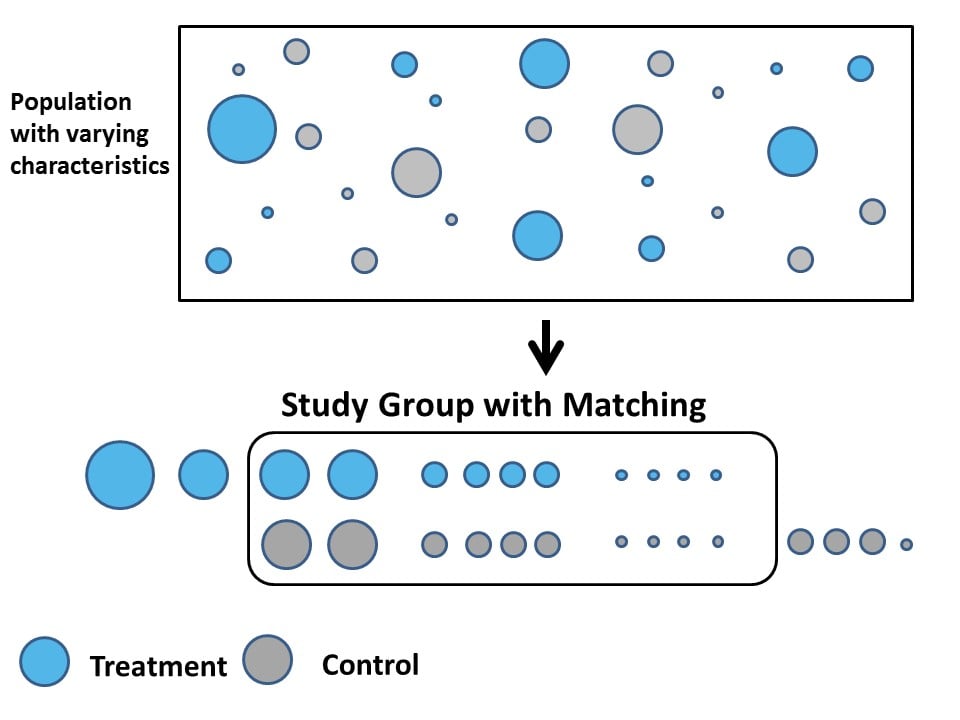
Propensity score methods identify data-driven matches – control groups – for treatment groups. Statistically-similar control groups are identified for each treatment group using the observable characteristics of the treatment groups.
How it works
- The treatment group and the donor pool of potential control groups are identified.
- The outcome variable and its relevant predictor variables (that are available in the data) are specified.
- The probability of being in the treatment group is estimated for each subject in the sample, given their observable characteristics.
- Treatment groups and control groups are matched based upon their likelihood to receive the treatment.
The treatment effect is estimated as the difference between the treatment groups and their statistically-matched control groups.
When to use:
- When there are many treatment subjects and many control subjects
- Example: A large sample of veterans and non-veterans, where veteran status is the treatment
- When the observable characteristics of the treatment and control groups overlap
- Example: Veterans and non-veterans have similar demographic, socio-economic, and educational characteristics
- When the treatment is not a function of unobservable characteristics that affect the outcome of interest
- Example: Veteran status cannot be determined by unobservable characteristics (like patriotism) if those characteristics also correlate with the outcome of interest (like earnings)