
September 27, 2017 •Mark Hutson

At Summit, we strive to develop staff knowledge and enhance the intellectual capital we provide to our clients. As part of this effort, Summit is holding the first session of an eight-week course on Dynamic Forecasting on September 28th.
Led by Summiteer Mark Hutson, Ph.D., the course is helping staff grasp the basic concepts of time-series and forecast analysis. The course is designed to be a graduate-level practitioner’s guide for data analysis and building useful forecast models, blending elements of data science and econometrics.
Our staff are learning how to conduct advanced time-series predictive analytics, to combat common problems arising from data-driven forecast models, and to let dynamics guide (but not dominate) a forecast model. While the course will contain theory, the emphasis will be on the practical considerations often facing clients, as well as how these models can provide useful outputs and business intelligence. Some of the major topics will include:
Analyzing Time-Series Properties and Understanding Data
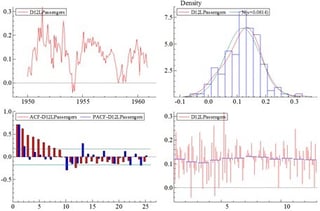
Time series data has a host of issues that can complicate traditional data analysis techniques. The course begins by identifying tools and techniques to neutralize these problems, as well as incorporating past dynamic information to expand the information set and increase the utility of our models. We’ll be spotting autocorrelation, seasonality, and cyclicality in our data.
Dealing with Data Shifts
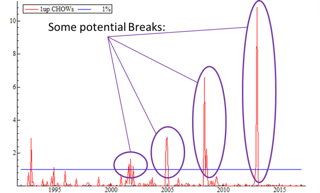
We will also focus on how to identify structural breaks and other shifts in our data. We’ll discuss the tools and techniques to identify structural breaks through testing, visual inspection, and modeling. We’ll cover methods for dealing with, or even predicting, upcoming shifts in our data. These will include developing deterministic correction terms, using saturation techniques, modeling conditional heteroscedasticity, and isolating predictive lags of our dependent variables.
Understanding Forecastability
We’ll discuss how to capture regular 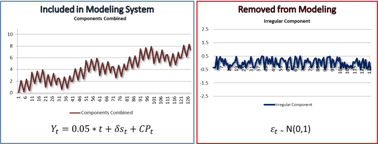 data dynamics, while stripping out noise and non-recurring data. We’ll touch on how to differentiate between data signals which explain what happened in the past and those that are likely to provide useful information in the future.
Model and Estimate Stability
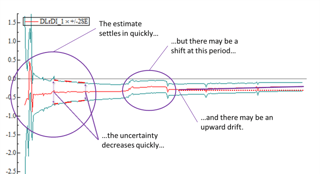
We’ll learn how to determine if models are providing consistent and stable estimates, and identify when models demonstrate drift. We’ll discuss how to deal with these inconsistent elements and build a steady forecast model that gets rid of any instability. Further, we’ll strategize on ways to avoid model instability from the first specification.
Presenting Forecasts, Quantifying Uncertainty, and Monitoring Outputs
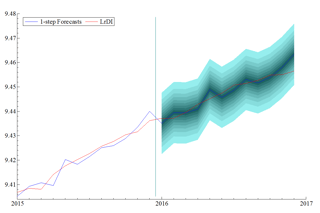
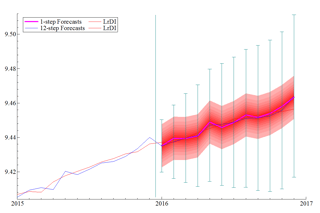
Finally, we’ll also cover different techniques for presenting and visualizing our forecasts. This will include quantifying statistical uncertainty in our models, tracking the evolution of our forecasts after each update, and displaying the evolution of our confidence in each estimate based on the historical data. We’ll cover common issues associated with different presentation styles, as well as various techniques for evaluating forecast performance. We will touch on identifying bias, forecast inefficiency, and comparing rival models.