
March 26, 2018 •Summit Consulting
This post was written by Summit Consultant Tori Puryear and Summit Senior Analyst Angelo Curto.
Practically everyone has a home toolkit that fits their basic needs, like a hammer with a few nails to hang a painting. But what if you needed to fix a hole in the wall or replace that leaky pipe under the sink? A more specialized toolkit is necessary. In the hands of master craftsmen, the right tool makes all the difference. Many firms have toolkits to fit their basic needs, but require specialized toolkits to get complex jobs done.
The most common basic tool for analysis among successful businesses is Microsoft Excel. Excel is simple, flexible, user friendly, and economical. It is easy for users to quickly calculate values and review small amounts of data. Excel is fully integrated with the Microsoft Office suite, coming at a low or no marginal cost. However, despite its prevalence and ease of use, Excel has a few shortcomings.
Computationally, Excel is limited in the following areas:
The value of a cell in Excel can be extremely difficult to track. Often, cell references look to a value on the same sheet and can be viewed side by side. However, in more complex calculations, cell references pull values from multiple sheets of different workbooks simultaneously. These references are then included in a series of nested functions to perform a calculation.
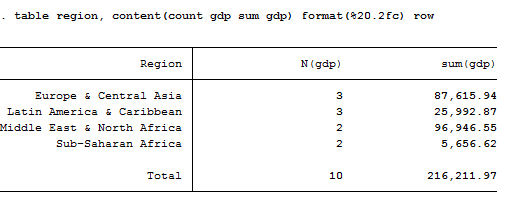
For example, the tables below show the breakdown of counts and total 2016 GDP per capita for 10 random countries by region. As the Excel table shows, each cell is linked to multiple cells, making it hard to trace. The second figure shows the same table created using one transparent logical line of programming code. The single line produces a table that contains the country count and total GDP for each region and overall. The format function allows each displayed number to have 20 decimal places and round to the first two decimals, this serves the purpose of showing more precision when summarizing variables.
Figure 1: Excel Produced Summary Table
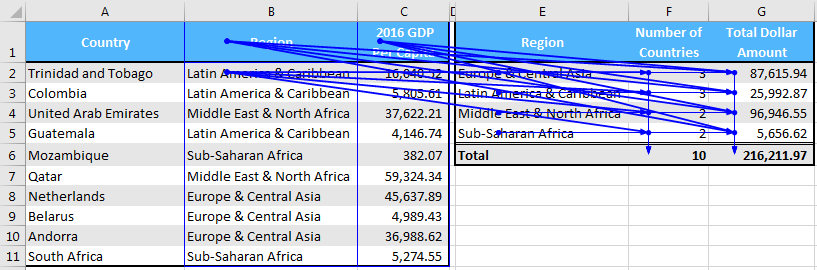
Figure 2: Stata Produced Summary Table
A lack of transparency impaired reproducibility. There is no straightforward way to trace the computational sequence and debug an error in Excel: missing values are handled inconsistently; output is poorly organized and inadequately labeled; and varied data organization unnecessarily complicates analyses.
Excel is notoriously susceptible to copy-and-paste errors. Suppose you have a workbook with 100 tabs, and each tab contains 100,00 rows and 60 columns. You want to create a “master tab” that does something simple, like summarizing one value from each tab. So, you calculate the sum of cell A2 for each of the 100 tabs, but for one of the tabs you accidentally click A3. Though small, this type of mistake can have significant consequences if the dollars at stake are high.
Excel is only capable of storing about a million rows and 16,000 columns of data. Seemingly, this is a lot, but for complex calculations it is limiting. For example, Amazon exceeded the data limits of an Excel spreadsheet in only 30 minutes during their 2016 Amazon Day sale. Businesses cannot efficiently use Excel if they wish to analyze picture data, such as web images or pdfs, text-based data, such as emails or web reviews, or relational data, like time-series or database data.
Beyond the storage limitations, Excel executes calculations slowly. Users with small data sets probably won’t notice, but when computing close to the storage limit, it can take many minutes to finish. Additionally, Excel is known to be unstable; there is the risk Excel crashes mid computation.
If Excel is the hammer and nails of data science, then programming languages are the master craftsman’s toolkit. While users may be quick to argue that Excel has its own event-driven programming language, Visual Basic for Applications (VBA), using VBA poses similar issues. VBA can address transparency and reproducibility by documenting calculations in code, but doing so increases file size and decreases speed, especially if users want to see the formulas. VBA, ultimately, is an advanced tool that excel users can add to their basic toolkit, but independent adaptable programming languages facilitate expedient resolution of complex jobs.
R and Python are among the most popular and powerful data science tools on the market. Both R and Python are low cost, powerful tools that businesses can implement to solve complex problems.
Tools are used to execute existing problems with greater ease. In the modern age, Excel is often not the best tool for the job. Programming languages are low cost high efficiency tools that can optimize the way any business functions.
You can read the rest of our Strength in Numbers blog posts here.