
January 14, 2021 •Michael Easterly
With contributions by Natalie Patten
This is the second installment of our three-part series on discrimination in mortgage lending and the analytical techniques that Summit Consulting uses to detect it. Last week, we introduced redlining and showed examples of analyses we perform to identify potential redlining practices by a given lender. This week, we will explore how we identify and measure pricing discrimination.
Using risk-based pricing, lenders charge borrowers different interest rates based upon each borrower’s risk of default. This practice has expanded the availability of mortgage credit to populations that formerly were unable to get loans. However, higher interest payments also increase the burden of loan payments and make it harder to accumulate wealth, so pricing the risk correctly is essential to maintaining equity and equal opportunity.
How can we know whether differences in loan pricing are attributable to lender costs, as opposed to race, gender, or age? Summit answers this question using regression modeling, predictive analytics, and statistical matching.
Regression modeling allows us to isolate the contribution of any one factor, such as race, to loan pricing and test whether it is statistically significant. Here, we use public data provided to the federal government via the Home Mortgage Disclosure Act (HMDA). It covers all lenders in a single state.
Before any regression modeling, notice that Black borrowers, on average, pay interest rates that are half a percentage point (0.50%) higher than whites for closed-end loans to purchase owner-occupied single-family homes. Over the course of a 30-year mortgage for $200,000, that amounts to about $20,000 in excess payments. Is this evidence of race discrimination in loan pricing? The short answer is no—we must use a regression model, shown below.
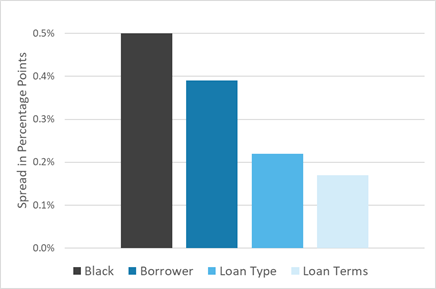
As we start accounting for other factors that determine interest rates, our estimate of the race pricing gap changes. In our data, we notice that:
Our regression model reveals that, after accounting for borrower characteristics, loan type, and loan terms, Black borrowers pay a premium of 0.17 percentage points, not 0.50 percentage points. Regression models provide a clearer picture of pricing discrepancies that are directly attributable to race.
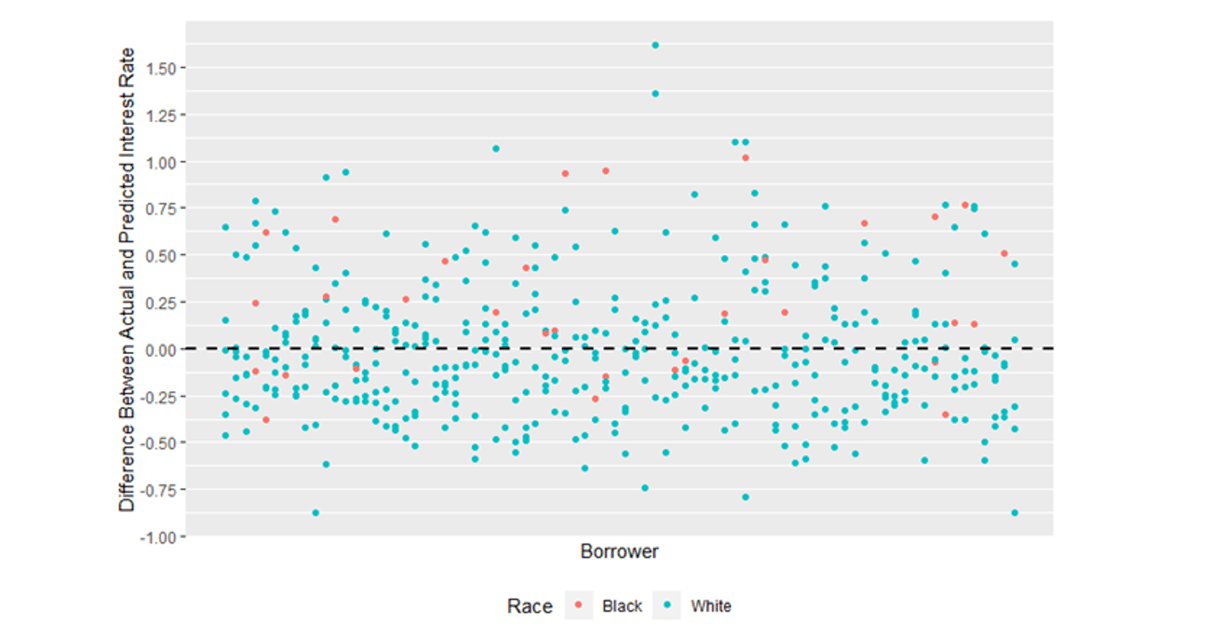
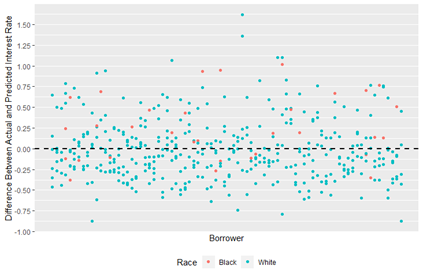
We use predictive analytics to estimate what interest rates would have been given all characteristics except race. If lenders discriminate against Black borrowers, our model would underpredict the interest rate on mortgages to Black borrowers and overpredict the rate paid by white borrowers.
The figure below shows the differences between actual and predicted rate spreads from the HMDA data for a single lender. The red dots indicate the premium above the predicted rate spread that Black borrowers are paying, while the blue dots represent the premium paid by white borrowers. That most of the red dots lie above zero suggests that Black borrowers are being overcharged relative to their personal and loan characteristics.
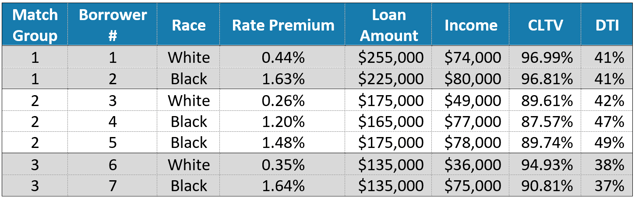
Statistical matching requires that borrowers be approximately equal in all characteristics before comparing the price of their loans. While regression modeling provides precise estimates of pricing discrepancy for all loans in a state or by a lender, statistical matching can be more reliable for subgroups among borrowers.
Consider the table below. Match Group 1 produces two borrowers with similar loan amounts, incomes, cumulative loan-to-value ratios, and debt-to-income ratios, yet the Black borrower pays a premium of 1.63 percentage points over the rate predicted by her credit characteristics compared to 0.44 percentage points for the white borrower—1.19 percentage points more. We see greater gaps in Match Group 2 and Match Group 3. This suggests that Black borrowers are being overcharged relative to their white counterparts who have comparable creditworthiness.
The combination of regression modeling, predictive analytics, and statistical matching ensures that Summit approaches loan pricing from every angle. Our findings represent comprehensive, statistically justified, and industry-current estimates of rate spreads, and our analyses can be customized and extended to meet the needs of specific clients and their data.
In part three next week, we’ll cover origination discrimination and predatory lending—the practices of denying mortgage loans to minority applicants based on race and giving minorities riskier loan terms, respectively.