Back in March, I posted about how Summit is approaching our forecasts for the U.S. economy during the COVID-19 pandemic and how we are creating reactive and flexible models that overweight new or recent data compared to traditional models. In the six and a half months since then, the volatility in many economic measures proven remarkably persistent. Or, to put it more bluntly: the economy is still a wild ride. As such, I am sharing a few notes on the key factors that are driving the current state of the economy, as well as the indicators that I am watching closely to understand what might come next.
What’s Happening Now
The United States is currently seeing what can be described as a two-speed pandemic recovery. For some markets and industries, the pandemic is muting economic activity only to a slight degree (or, for a few, even seeing substantial increases in activity). Other industries are being ravaged with no end in sight. Here are a few things to consider as we look at the state of the economy:
- The Stock Market - No indicator better captures this duality than the stock market, where record highs are nestled between stories of unemployment and COVID hot spots. The highs in these indices, however, obscure the fact that the rise is driven by the performance of only a few companies, a high performance which offsets the struggles of the rest of the market. For example, lower travel rates are devastating demand for oil and air travel, so companies like Exxon, Boeing (Dow), Hertz, and Callon Petroleum (S&P 500) have been some of the worst performers since the pandemic hit. However, their drops are outweighed by massive run-ups in firms like PayPal, Amazon, Apple, FedEx, and Netflix. Headline numbers, especially those using performance weights, obscure discrepancies like this that will drive the path of the economy this fall. Some parts of the economy are thriving, yes, but to say all are would be papering over the real suffering in other areas. The mean obscures the variance.
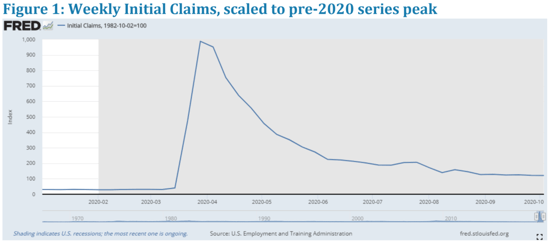
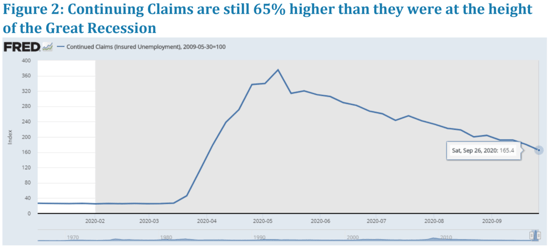
- The Labor Market - Of course, the labor market is showing the opposite side of the two-speed coin, where the headline numbers are terrible but there are areas that remain remarkably strong. Taken at face-value, the labor market’s numbers are daunting, showing historic levels of layoffs; we see initial weekly unemployment claims exceeding the series’ previous statistical peak [1] each week since March (see Figure 1). Continuing Claims, though dropping from the peak of nearly 25 million, continues to be above historical figures, being a full 65% higher than at the height of the Great Recession (See Figure 2). As with the stock market, the bulk of these claims have been concentrated in lower-paying and blue-collar jobs, while white-collar professions have more scope to work remotely. Because of this, we see one chunk of workers humming along, while another segment is paralyzed. Once again, the mean obscures the variance.
What the Future Holds
So, what does the two-speed system foretell? Well, although gains or losses are concentrated in portions of the economy, they need not stay this way. I would doubt whether they even can stay this way. This segmentation is not stable. Currently, some factors exist that could disrupt the current equilibrium. Here are a few things to consider that are going on right now:
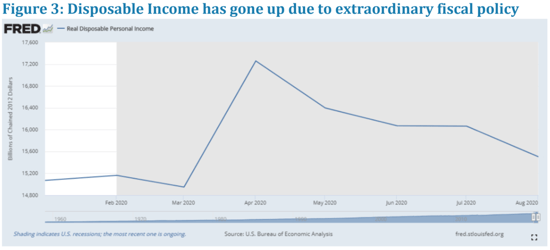
- Lapses in Payroll Protection Programs - The current split in the labor market may widen as the Paycheck Protection Program (PPP) and Payroll Support Program (PSP) stipulations of maintaining employee levels have lapsed. We have already seen several anecdotal news stories of “pent up layoffs,” whereby employers let go of employees after they fulfill the grant provisions of the PPP. The expiration of the PSP requirements has already seen several airlines furlough or lay off workers since October 1. Additionally, longer-term unemployed workers may be feeling the bite as cash dwindles since the expiration of outsized unemployment benefits on August 1. One of the strange statistical artifacts of the CARES Act was that disposable income went up in April (see Figure 3), which underlines how effective the “economic bubble wrap” features of the CARES Act were. With many of these provisions now tapering off or expiring, the performance of the economy may begin to change significantly.
- Future Stimulus Programs - The recent political fight over further stimulus, whether it be another large package like the HEROES Act or a more targeted one like the proposed airline-only package, throws uncertainty into more fiscal response. As Federal Reserve Chairman Powell recently suggested, most forecasters have been baking in further stimulus into their projects. Continued lack of stimulus could see further deterioration in forecasts and economic conditions, especially if those households receiving these benefits begin to lose their homes or declare bankruptcy in large numbers.[2]
- Ending Moratoria - Moratoria on evictions, foreclosures, commercial evictions, and other programs are starting to reach their end, potentially throwing further upheaval into some of the markets that have been holding up well.
Because of these factors, there is a lot of downside risk for the economy, and this is before we have even considered the effects of pandemic itself. The U.S. is currently seeing more than 60,000 positive COVID cases again, with case levels last at this point in the middle of August. Throw in a touch of uncertainty with the upcoming election impacting the likelihood of fiscal response, and the probability of a sudden recovery seems more remote. The only thing that is certain is that the next 3-6 months are going to be turbulent times.
What I Am Watching Right Now
I am going to be keeping my eye on a few indicators to get a sense of how the next phase of the pandemic is going to go -- and what the end of 2020 and the first quarter of 2021 may hold:
- Labor Market - Initial Claims and Continued Claims. I am going to continue watching the weekly unemployment insurance claims (both UI and PUA), as that gives the most up-to-date data in the closest thing we have to real time. Continuing Claims is still above 8 million people which, while lower than a few months ago, is massively elevated. Without substantial improvement in this number, or with a strong uptick in initial claims as the PSP and PPP expirations start to bite, I would expect to see significant deterioration in other indicators as the fiscal and monetary policy supports are no longer able to prop up the economy. Additionally, we are doing a deep dive into statistical anomalies buried in these data regarding reporting and approvals from early in the pandemic (especially regarding the Pandemic Unemployment Assistance numbers).
- Housing Market - MBA Purchase and MBA Refinance. This is another higher-frequency release that can give information at a small lag. The strength in purchases and the lower payments for consumers refinancing has been one of the few bright spots in the economy. Maintained strength in both areas could continue to support consumption and residential investment in the economy. Continued high levels in both will likely mean that the downside risks are not materializing quite yet. Contrarily, if foreclosure and rental moratoria start expiring, this might show up negatively in these indicators as the dynamics change in forbearance, foreclosure, and any uptick in supply of distressed residential, multifamily, or commercial properties on the market. In particular, if refinances slow and distressed properties temper (or even drag down) home prices, we could see a quick slowdown in consumption.
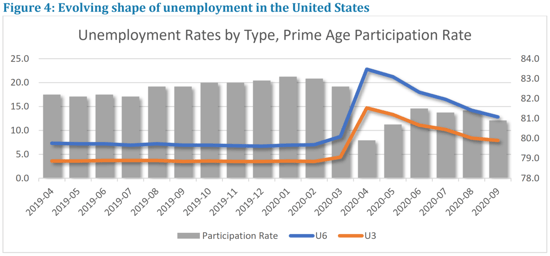
- Unemployment - U3 and U6, Age 25-54 participation rate. In addition to the headline unemployment rate, I will also be interested in seeing how much of the labor force is getting shifted into “marginally attached” or “part-time for economic reasons” categories. The wedge between the two will help guide my understanding of how permanent the scars from COVID are on the economy: are the unemployed being reabsorbed into the economy as full-time workers or are we rebuilding the labor market with a higher level of part-time, gig, and tenuous workers? If the latter is true, confidence will likely remain low and economic activity may recover much more slowly. See Figure 4.
Obviously, I could go on, particularly around consumer spending and business investment, each of which will be hugely influential in the next few years. But these three categories of indicators are where we can get the most influential economic information that will give an idea of the next few months. The economy is at a crossroads, and, as modelers, we face a continuingly unstable environment around which to make our predictions. When modeling projections for our clients, we need to be diligent.
1 In 1982, the series had a one-week peak of 695,000 initial claims.
2 This is particularly acute for those blue-collar workers who entered the recession in tenuous financial states. A widely-reported Fed study from May 2019 that found 61% of American households would struggle to cover an unexpected expense of $400 is ominous, as those 61% of households are both more likely to be amongst the unemployed and are more reliant on the $1,200 stimulus and $600 increase UI payments. As these funds run out, these same households face significant cuts in consumptions, bankruptcy, or even household displacement.

