
March 25, 2020 •Mark Hutson
At Summit, we provide our clients with data-driven insights, typically basing our results on readily available historical data. We use these data to build models for assessing policy decisions and understanding economic impacts based on what we know has happened and what we think will happen next. Then we combine our judgement with historical information to predict the magnitude of these results. Yet today, many of our clients are scrambling to understand the most likely impacts of COVID-19 on their respective portfolios of business, despite it being an event with few (or any) historical parallels. The question becomes, how do we use historical data and existing tools to determine anything better than a wild guess?
On Thursday (3/26), we are expecting the first Initial Weekly Unemployment Claims report that will reflect the impacts from the public response to the virus. The highest this measure has ever been was 695,000 claims in October 1982. For perspective, the peak during the financial crisis was 665,000, when the U.S. population was much larger than in 1982. Currently, the consensus forecast is for approximately 750,000, which is not much of a consensus, as several of the member forecasters are predicting several million claims this week. Similarly, it is not hard to find professional forecasters and policy makers (i.e. not internet cranks) who suggest the U3 unemployment rate (the rate most commonly cited in the press, which is the proportion of people actively seeking a job) could crest at 20% or even 30%. For context, unemployment peaked at 24.9% during the Great Depression, a period with few relevant details to the purposeful shutdown going on today.1 These numbers are unprecedented, and our models are not trained for this type of phenomenon. So again, how do we deal with this?
Summit knows the answer is a combination of humility and expertise. As we work with our clients to model COVID-19’s impact on student loans, mortgages, federal credit portfolios, farms, and rural lending facilities, we stress the following:
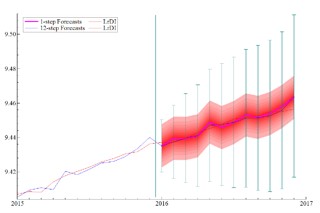
• Embracing Uncertainty: When working outside the historical data, we know we will not get the numbers exactly right. So, as part of our push for transparency and honesty, we need our clients to see not just what the data are telling us, but also what they are not. Whether this is done through simple graphical depictions of confidence bounds and error bars on charts (see Figure 1) or more sophisticated tools like stochastic simulation, we can convey both what we think to be likely and what we just can’t know.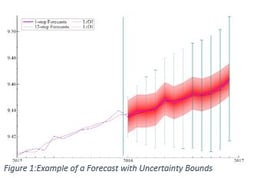
• Responding Quickly: Most of our models assess all data as equally predictive, but today we need our models, estimates, and forecasts to weight new developments quickly. Using a variety of techniques, we can weight (and re-weight) down-side scenarios and predictions to make our tools and estimates more responsive to current conditions. As we know more, we can react quickly while still maintaining the statistical rigor that comes from having a formalized system. While responding quickly, we remind ourselves that the relationships in our models are not broken, but rather that we are testing new bounds and that the models can still provide the guardrails to evaluating forecasts and policy proposals consistently.
• Frequently Re-evaluating Priors: To modify Nixon’s famous (and possibly apocryphal) utterance “We are all Keynesians now”, we are all Bayesians now. That is, we need to acknowledge that our expertise will drive a lot of the estimates and that we will need to revisit our prior assumptions each time new data comes out. By constantly assessing and reassessing our predictions, we will be able to meld our understanding of what the data show and what we know (or don’t know) is changing.
In summary, we are actively working with our Federal and private clients as they develop policies to respond to this extraordinary situation. Our goal is to provide them with as much information as the data can provide, the necessary context to understand what the data cannot provide, and the proper advice needed for designing ways to formulate appropriate responses.
1 While the gears of the economy seized up in the Great Depression much like they are projected to today, a lot of that was also likely due to a policy response (or lack of response) opposite of what is being considered now. In the Great Depression, bank failures and tight monetary policy made credit and money scarce. Today, the Fed has loosened monetary policy, making money available to pretty much any borrower with a pulse and a T-Bill.