
May 24, 2021 •Balint Peto


Welcome back to our blog series on program evaluation. If you haven’t already, check out last week’s post on administrative data. In this post, we’ll dig into impact evaluations.
As mentioned in our first post, there are many types of evaluations to conduct depending on the program need and available information. An important evaluation to note is an impact evaluation. It can help answer research questions like “What effects did the program have on its participants and stakeholders?” and “Should the program be continued or curtailed?”
Impact evaluations aim to disentangle causality. They look at an intervention, such as a federal policy change, and use statistical or econometric methods to show whether the intervention caused the change in intended outcome. To prove a causal relationship, three conditions must be met simultaneously:
Impact evaluations typically spend the most time and effort on the third condition: excluding all other possible factors that may have caused the same impact other than the intervention at hand.
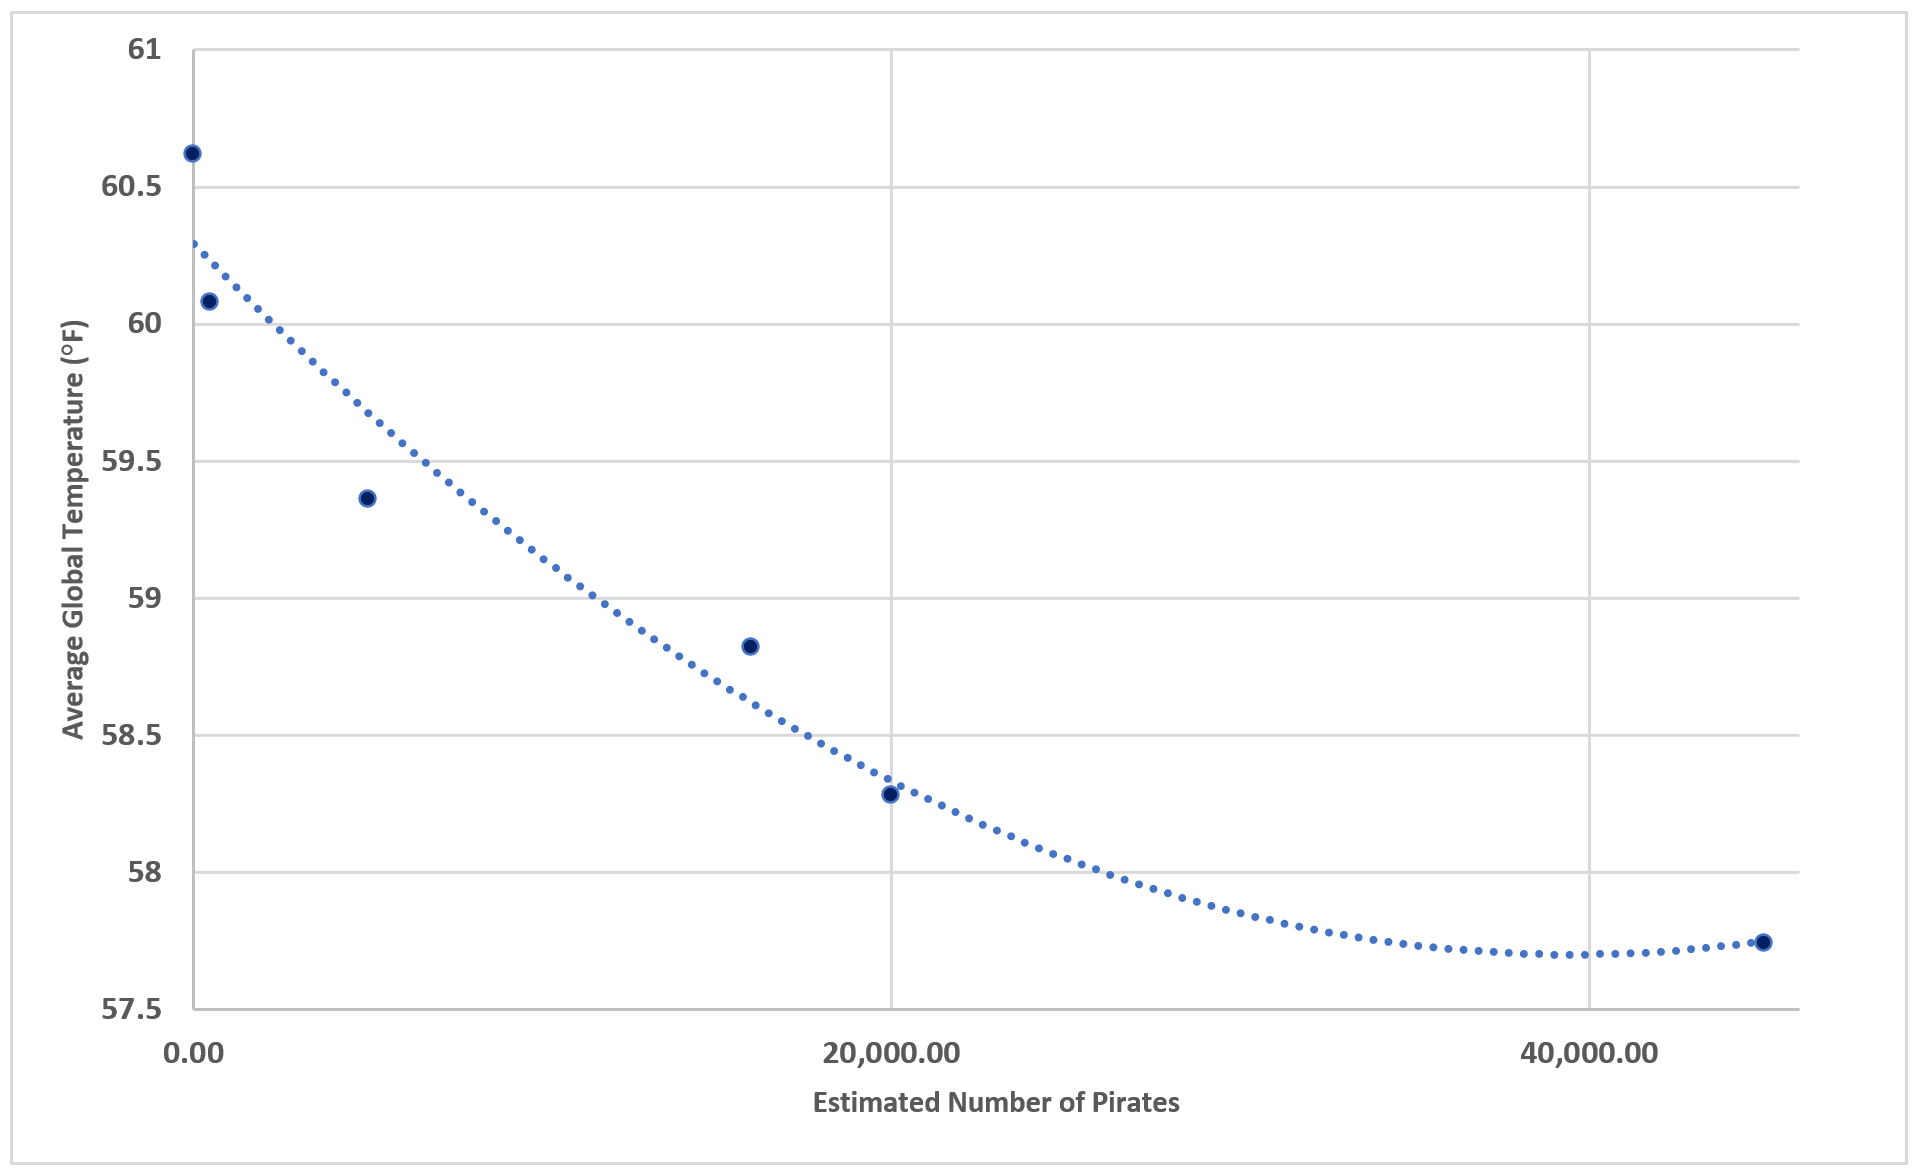
A well-known thought experiment asks: Can we fight global warming by increasing the number of pirates? That is, do pirates cause a decline in global temperatures?
 Source: Metin’s Media & Math
This may sound like a silly question, but if we look at the graph above, it is very clear that historically, there is a negative correlation between the number of pirates and global temperatures. As the graph shows, the weather was colder when there were more pirates. To the superficial observer, it could make sense to recruit pirates to fight global warming.
Let’s see if the three conditions of causality we talked about above apply. Does the decrease in the number of pirates precede the increase in temperatures? Normally, this is the easiest question to answer. In this case, though, it’s hard to say and they probably just coincided. Is there a correlation between the number of pirates and global temperatures? Clearly, yes! Are there no other explanations for the relationship, and is it non-spurious? Typically, this is the most difficult question to answer. In this case, an easy alternative theory could be that rising temperatures are caused by increased carbon dioxide emissions, while the decrease in the number of pirates is caused by strengthened security of international waters. But we do not know for sure. It takes special statistical and econometric analyses to show non-spuriousness.
The gold standard of excluding competing theories of causality to answer our third question is called the randomized controlled trial (RCT). The idea is to randomly assign subjects to “treatment” and “control” groups, and randomization ensures that statistically the two groups are not different from each other in observed and unobserved characteristics. They are only different in whether they received the treatment or not. Therefore, any difference in outcomes must be the result of the difference in treatment, right? Not quite.
Unfortunately, RCTs are often difficult, impractical, unethical, or even impossible to implement in practice. Suspected serious consequences of applying a certain medical treatment to patients in the treatment group would be unethical. To test the pirate-temperature relationship using an RCT would be impossible: we cannot somehow randomly assign the world into two groups, one with and one without pirates.
Therefore, we must come up with methods that are just as good as RCTs in excluding alternative explanations but are more feasible.
 Source: Fulcrum Analytics
There is a clever and often more feasible way to imitate RCTs: quasi-experimental designs. For example, once a policy has been implemented, we can no longer randomly assign subjects to treatment and control groups. One way of tackling this problem is to use propensity score matching. It is a quasi-experimental technique that takes all the characteristics available in the dataset and uses statistical methods to create groups that are similar in all characteristics, but the treatment.
For example, to examine the impact of air pollution on health, we can take two groups of people, one from the countryside and one from the city. We can then find all the available attributes of both, such as age, gender, income, etc., and select city-countryside pairs of participants with similar statistical characteristics. Then the differences in health outcomes from the two groups can be attributed to the only difference between them: one lives in the countryside, the other in the city. Naturally, there are limitations to this approach. It requires high-quality and rich data with a large number of observations, and we have to make the assumption that unobserved characteristics are either similar in the two groups or do not have an influence on the outcomes.
Another way to imitate RCTs is called the regression discontinuity design. It uses thresholds, which are cutoffs for eligibility, and claims that those just under and those just over the threshold are very similar in all characteristics, except one group received the treatment and the other did not. For example, a 2016 study by Philip J. Cook and Songman Kang demonstrates that “those born just after the cut date for enrolling in public kindergarten are more likely to drop out of high school before graduation and to commit a felony offense by age 19.”
Regression discontinuity designs have limitations, though: they need a threshold or cutoff, and causal claims can only be made about subjects close enough to the cutoff on both sides.
There are also many other quasi-experimental methods (such as natural experiments, difference-in-differences designs, interrupted time series, etc.), each with its own advantages and disadvantages. It takes careful consideration to select the right one for the given circumstances of data quality, availability, budget, and timeline.
Next week, we’ll look at how all of the methodologies we’ve discussed come together in a mixed-methods evaluation.