
September 13, 2018 •Mark Hutson

**Note: This post was written in September 2017.**
The hurricanes that hit Texas, Florida, Puerto Rico, and the U.S. Virgin Islands in 2017 left devastating destruction in their wake, resulting in untold costs and disruptions to millions of people, businesses, and the government. The necessary response effort to address the immediate damages, related negative economic impact, and subsequent rebuilding, will use tremendous resources and exceptional diligence. This includes costs and long-run impacts that will not be realized for several years, compounded by the uncertainty around how large the impact will be on individuals, businesses, and government agencies operating in or around the affected areas.
Aside from the local economic impact, less emphasized is the waterfall effect on non-local entities that serve or operate in the geographically affected areas. Several government agencies, particularly those who manage large national programs, have a need to monitor the downstream impact of natural disasters on their local operations. Understanding the nature and size of the impact enables agencies to alter their operations to mitigate the negative effects and to plan contingencies. Mitigation impact strategies often require changes in agency priorities and behaviors, reshaping their budgets, and reallocating resources to cope with the devastation. Agencies are tasked to predict the magnitude of these changes, often making estimates of the storms’ impacts without any solid data or reliable information to make such estimates.
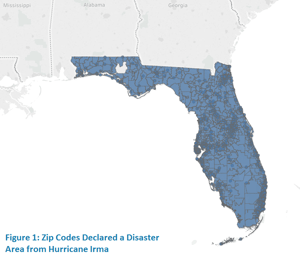
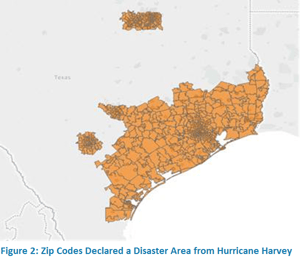
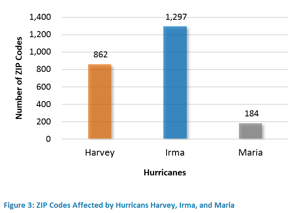
Summit recently tackled the challenge of developing a methodology to assess how Harvey, Maria, and Irma will impact revenue collections for an agency’s operations in the affected areas over the next several years. To cope with fluid requirements and shifting regional areas of impact based on ZIP code-specific information, the methodology needed to be developed, tested, certified, and automated. Further, the preliminary estimates were needed within two weeks to meet client requirements for responding and altering their behavior in the impacted areas.
The Summit team banded together and assessed the challenge, and ultimately developed a multi-pronged approach to answer the question. The team decided to combine machine learning with several impact evaluation, panel, geolocation, and forecasting techniques. Further, we automated the analysis to cope with additional ZIP code information as it comes in and to be used for any subsequent disaster that disrupts DMS operations.
The first step in the process was to assess the magnitude of the impacted areas and determine the amount of collections that would have been registered in absences of the storms. This assessment required developing a database of all active and outstanding debts at DMS (and contracted third-party servicers), using programs and filters to turn a “big data” problem into a usable data file. Based on information disseminated by the IRS, the team developed a portfolio of outstanding debts affected by the Hurricanes.
Second, the team used regression tree techniques to estimate the baseline of what would have been collected. Based on historical 2-year collection cycles, the team split the outstanding debts with similar characteristics and collection probabilities into similar “segments” for each Creditor Agency. Based on these historical collections estimates for each group, the team developed the estimate payments that would have been made on debts currently outstanding in the affected areas. The team then adjusted these estimates slightly to account for age differences between the decision trees and the outstanding debts to better reflect the expected collections. This estimate, a time-adjusted predictive estimate of expected collections, became the new “maximum” impacts of the hurricanes in the affected areas.
This baseline represents the ceiling of losses from the storm. For the ceiling to be correct, however, would imply that all debts in the affected zip codes would be written off and no debt collected upon, ever. While businesses and individuals in these areas are suffering, it does seem overly pessimistic to assume that they would never be able to make any payments back to taxpayers.
As such, Summit developed three methodologies for assessing the impact on debtors’ ability to repay. The three approaches, when used in conjunction, provide a robust and responsive estimate of what collections from affected debtors might ultimately be. This approach involves:
The first analysis, using multiple simulations, develops a number of “recovery paths” that collections might take. As the local economies rebuild, and debtors become more able to satisfy their obligations to taxpayers, then collections statistics would begin to increase. Summit is developing several simulations based on various assumptions as to what such recoveries (and collections) would look like over the next several years. As data come in, different paths will likely be eliminated as not actually occurring, allowing policy makers to focus on the remaining simulations to refine the estimated collections in these areas and plan accordingly. The simulations touch on numerous scenarios, including divergent impacts and recovery rates for small businesses, local unemployment, migration, and capital (re)accumulation.
 The second analysis, using “proximate zones”, provides an additional tool to refine the overall costs in real time. Using geolocation data, the team has developed bands of neighboring economic areas, identifying debtors that are within 10, 50, and 100 miles of the affected areas. The team is automating difference-in-difference and propensity-score matching code to identify how surrounding areas are being impacted by the disasters and recovery, and comparing these impacts to the rest of the US. This will provide bounds on the economic impact of the storms, as well as signal additional collection reductions outside the areas directly impacted by the storms. These estimates will further refine the estimate of overall lost collections relative to baselines, as well as help signal the speed at which recovery is occurring for the impacted areas.
The third analysis, developing a panel of other disasters, examines several recent disasters to inform the analysis. Using data from the NCDC’s Billion Dollar Disaster Database, Summit is identifying the localized impacts that disasters had on the collections and recoveries for DMS numbers. While every disaster is different, this additional information is helping refine the scenarios in step one, as well as providing context for expectations of future recoveries.
As agencies cope with the fallout of these disasters, knowledge and forethought will be paramount to determining the lasting legacy of each of these disasters. Summit has leveraged several cutting-edge analytical techniques to provide DMS with as much information as possible on how their operations will be affected by these disasters, as well as a road map for refining these estimates in real time. Borrowing best practices from the fields of data science, econometrics, and impact evaluation, Summit’s team quickly developed a novel methodology for answering key questions for stakeholders.