
August 6, 2015 •Melissa Cichantek
* Welcome to the second post in Summit's 2015 Summer Intern Series! See below for Summer Associate Alyssa Cuyjet’s essay. Click here to learn more about our Summer Analyst/Associate program. *
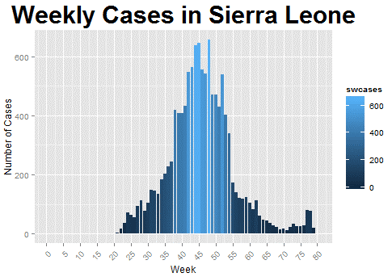
Last summer, the news swarmed with updates about the Ebola outbreak occurring in West Africa. The outbreak quickly escalated, highlighting the need for quick medical responses. Along with these medical responses came testimonies of how disease modeling helps alleviate outbreaks and save lives. In the latest Ebola outbreak, Guinea, Liberia, and Sierra Leone were the most strongly affected. Notably, Sierra Leone had the most severe outbreak, were officials observed a peak of 500-650 new cases each week. Because of its severity, I chose to model the outbreak in Sierra Leone and explore how disease modeling parameters work.
Figure 1: Weekly Ebola Cases in Sierra Leone
The SEIR model is a compartmental model which uses a set of differential equations to divide the population into four categories: susceptible, exposed (the incubation period of a disease), infected (showing symptoms), and recovered at any given time. The parameters used for this model are transmission rate, incubation period, infectious period, fatality rate, and the basic reproduction ratio. Using information from WHO, CDC, and other research publications, I obtained estimates for these parameters. Then, I used R to solve the differential equations and plot the movement of the population between each of the four compartments (i.e., susceptible, exposed, infected, recovered).
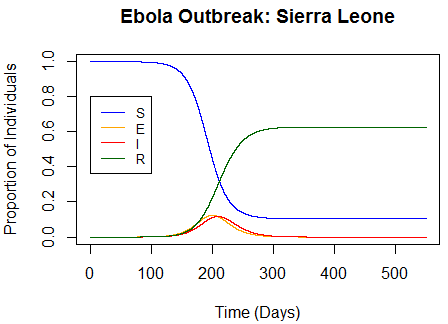
Using an average value of 10 days for both the incubation period and the infectious period (as reported by the WHO and CDC) and a reproductive ratio of 2.53 (as reported in Althaus, 2014), the transmission rate was estimated to be 0.253 and the resulting model can be seen below. I also assumed that 30 people were originally infected and the remainder of the population (6.09 million) were susceptible. Comparing this model to the weekly number of cases actually observed in Sierra Leone, we can see that the model—while at a much larger scale—roughly follows the pattern of when the outbreak started, when it peaked, and when it began to decline.
Figure 2: Modeling the Ebola Outbreak in Sierra Leone

By changing the incubation period or infectious period by one day, the onset of outbreak differed by several days and the proportion of the population infected changed by about 2-4%. Changing the infectious period had the greatest impact on the model and I concluded that accurate knowledge of the disease is very important in order to use this model effectively.
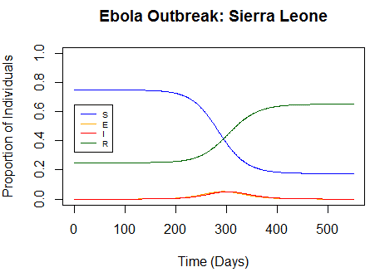
To see how vaccinations could affect this kind of outbreak, I ran the model with a new assumption: that 25% of the population was initially vaccinated and therefore immune to the disease (which would put them in the recovery compartment). The resulting model shows a much smaller outbreak occurring at a later time. This illustrates that vaccinations help to minimize and slow outbreaks.
Figure 3: Modeling the Effect of a Vaccine on the Ebola Outbreak in Sierra Leone
During outbreaks of Ebola and other infectious diseases, researchers can use this type of SEIR model to estimate the magnitude of an infection and the amount of resources necessary to contain the disease. Public heath data is not only fun to work with--it can also help save lives.