September 29, 2014 •Brian Wong
 In the previous post we talked about sampling, a common way to collect data, and oftentimes the first step in a predictive analytics process. This time, we’ll describe how to apply stratified sampling to a problem many soon-to-be newlyweds have encountered: How much and what kind of beer should I serve on the big day? We can use statistical sampling to help.
Let’s say you’re getting married and have invited 300 people from three different states to your wedding. Because you’re a gracious host, you want to optimize the beer selection to your guests’ tastes. Calling all 300 people to ask their preference is impractical. So, obviously, you decide to pull a statistical sample of 30 guests (10% of the population), stratified by their state of residence, because you have reason to believe that geography influences beer preference.
Suppose the breakdown of the guest list by state of residence and favorite beer is as follows:
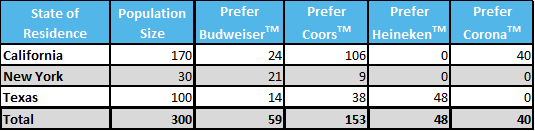
You can see that there is a distinct preference for beer type based on a guest’s home state. Stratifying by state can thus help you reduce the variance of the population estimate for the type and quantity of beer you should serve at the reception. If you don’t stratify and just randomly sample 30 guests, you could potentially only sample people from California, resulting in way too many cans of Coors and a bunch of angry New Yorkers.
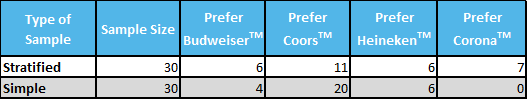
Instead, you can allocate samples across strata proportional to the size of the strata by randomly selecting 17 Californians, 3 New Yorkers, and 10 Texans from your guest list. For comparison, beer preferences from a stratified and simple random sample of guests are shown below:
Once you extrapolate the above results to the entire population of 300 guests, you get the following:
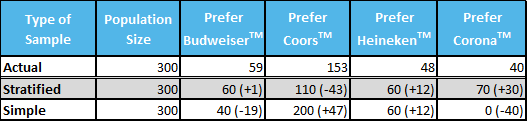
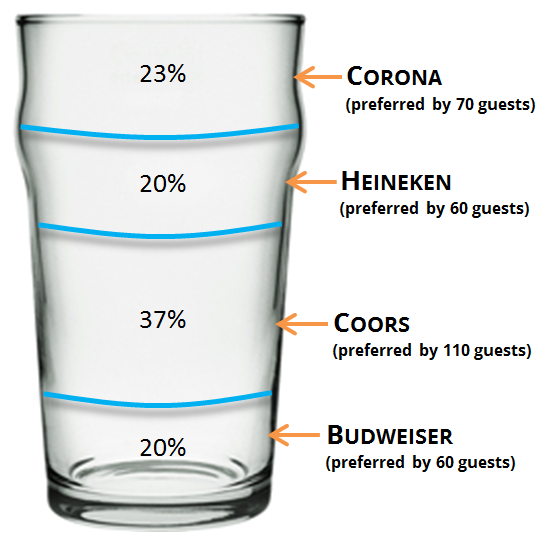
 The graphic to the right represents the quantity and type of beer to be served at the wedding, which was determined by stratified sampling. As you can see in the table, simple random sampling could have led us to not include Corona on the menu at all, disappointing the Californians that enjoy that beer.
Notice that, although not always the case, in this instance, the stratified sample provides a more accurate estimate of the type and quantity of beer you should buy, ultimately making you a better party host.
This wraps up our short discussion of sampling, but watch out for more forays into sampling design in the future! Next up, we apply predictive analytics to the glamorous world of cinema.
This post was written with the help of Sejla Karalic and Jon Carver.