
June 30, 2022 •Summit Consulting

With contributions by Gabriel Cohen, Lorenzo Rollhauser, and Steven Penarrieta
The team at Summit Consulting set out to determine whether racial disparities persist in the single-family mortgage finance market in Washington, DC, and whether these disparities are the result of financial characteristics of borrowers or discrimination.
To begin, we constructed a dataset of purchase mortgages from 2018 to 2020 using data from the publicly available Home Mortgage Disclosure Act (HMDA) dataset with standard data trimming of key variables (that is, removing observations with missing variables and retaining the inner 98% of continuous variable distributions) and performed the following analyses on data from Washington, DC:
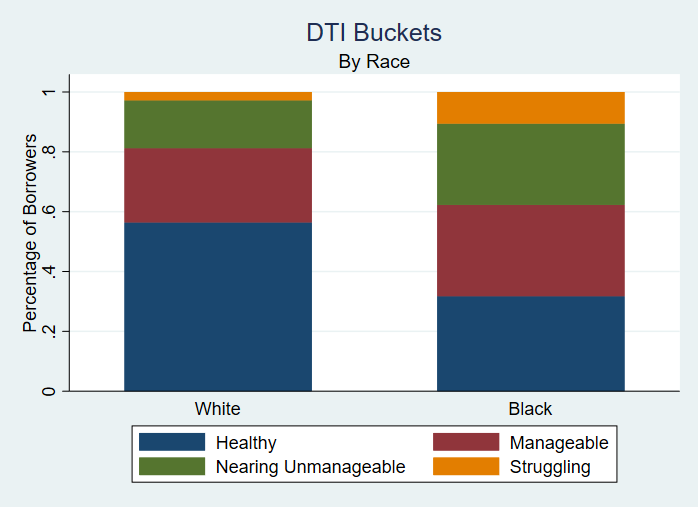
Comparing descriptive statistics of white and Black borrowers is a good way to initially assess their relative risk profiles. Typically, lenders favor higher incomes, lower loan-to-value (LTV) ratios, lower loan amounts, and lower debt-to-income (DTI) ratios. The following table contains average values for white and Black borrowers in our dataset:
| Race | Total Loans | Avg. Income (Thousands of Dollars) | Avg. LTV Ratio |
| White | 12,528 | $182.46 | 82.56 |
| Black | 3,027 | $131.38 | 91.75 |
| Difference | $51.08* | -9.20* |
* Indicates a statistically significant difference at a 5% significance level based on a two-tailed t-test.
As the table shows, white borrowers have higher income levels and lower loan-to-value ratios. The asterisks indicate each of the comparisons are statistically significant between the two groups, conveying the different risk profile of each group. The graph below provides the distribution of the DTI ratio for each group of borrowers. Like the previous table, Black borrowers appear to be riskier to lend to when considering a relatively smaller percentage are in the ”healthy” and “manageable” categories than their white counterparts.
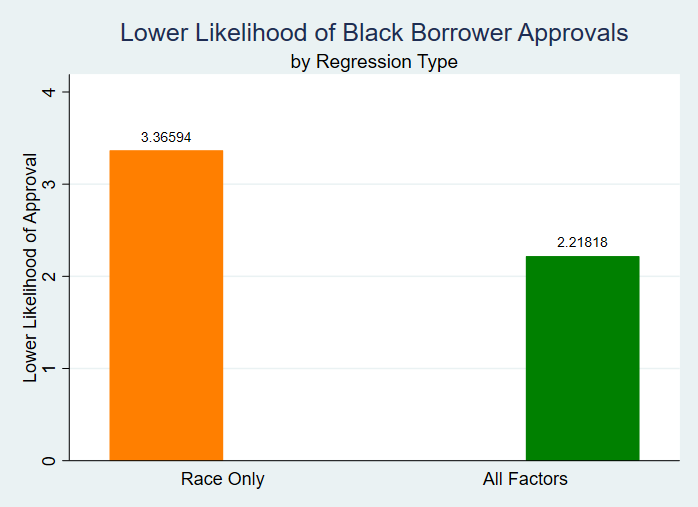
To perform the regression analysis, we executed four regressions, two for approvals and two for estimating rate spread. For each of the groupings, one regression only included the race variable and the other included factors such as the loan type (for example, a Federal Housing Administration loan), confirming status, loan amount, property value, borrower’s income, LTV ratio, and borrower’s DTI bucket. As expected, the impact of the borrower’s race reduces with the inclusion of the additional factors, but it remains statistically significant at the 5% level.
As the graph below illustrates, when only race is considered Black borrowers were about three times less likely to receive loan approvals than white borrowers. When the additional factors were considered, Black borrowers were about two times less likely than white borrowers to receive loan approvals.
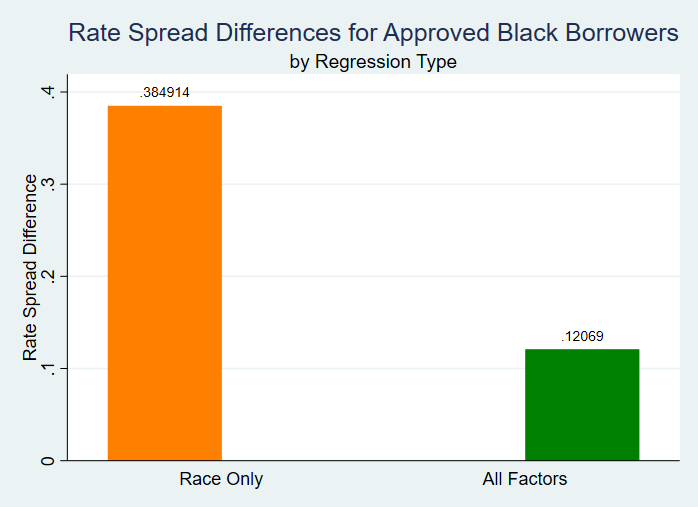
As the next graph illustrates, when only race was considered, Black borrowers paid approximately 38 more basis points than white borrowers upon receiving a loan approval. When the additional factors were considered, Black borrowers paid approximately 12 more basis points than white borrowers upon receiving an approval.
Black borrowers in Washington, DC, present as slightly riskier than white borrowers due to their lower incomes, higher DTI ratios, and higher LTV ratios. However, after controlling for the key risk factors and loan attributes, Black applicants and borrowers still received discriminatory treatment in the lending process in the form of lower approvals and higher interest rates.
Photo by Katelyn Warner on Unsplash