
February 24, 2017 •Alexander Melton
Every day, I use predictive analytics to help litigators win their cases. In addition to my work, I like to use my predictive modeling abilities on events I find interesting including the academy awards. Predicting the Oscars is a major challenge for modelers everywhere. Outlets such as FiveThirtyEight, PredictWise, and others publish their model results each year. Based on my model, the favorite to win Best Picture is La La Land with a winning probability of 69.03%.
As a complicated balloted event, the Academy Awards presents a challenge for predictive modeling. Nominations and voting for the Academy Awards is quite complicated. Each category has its own rules. All members can nominate and vote for Best Picture. The award for Best Picture is special in two ways (as of 2009). First, it has the largest pool of nominees, up to ten. Second, it uses instant runoff voting. The varying number of nominations presents a unique challenge for modeling. We will see how technique for dealing with this in a bit. Here is a key question for modeling: what does a Best Picture winner on paper even look like?
Most Academy Award prediction models rely on other award show results for their predictions. My model does take these factors into consideration. Nonetheless, I examined numerical aspects of the nominated films. Examples include a film’s length and budget.
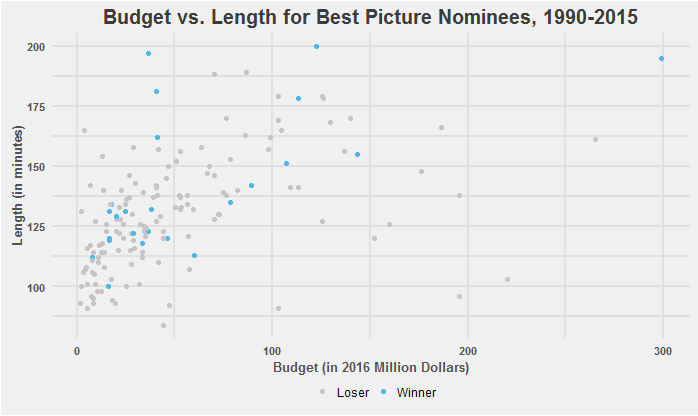
As we see from the graph above, Best Picture winners are at least one hundred minutes long. An overwhelming majority being over two hours. On the other hand, having a bigger budget is not that important to winning. Only five films winning with a budget over $100 million in 2016 dollars. That one film at a staggering $299 million dollars and a length of 3 hours and 15 minutes is Titanic.
While there is diversity in time and length, there are some general rules of thumb. First, movies need to be at least an hour and half, with two hours being much better. Second, a bigger budget doesn’t mean anything (sorry, comic book blockbusters). Another important factor is critical reception. It's not a far-fetched idea that a movie can be well liked by both critics and the academy. Reviews of film’s can be incredibly subjective, but we need a measure of aggregate feeling toward a film. Rotten Tomatoes provides such a measure. The figure below shows a time series of winner's Rotten Tomatoes scores against the mean of all the nominees.
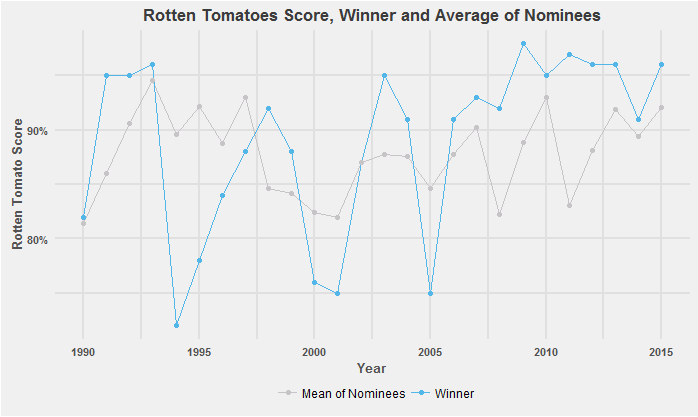
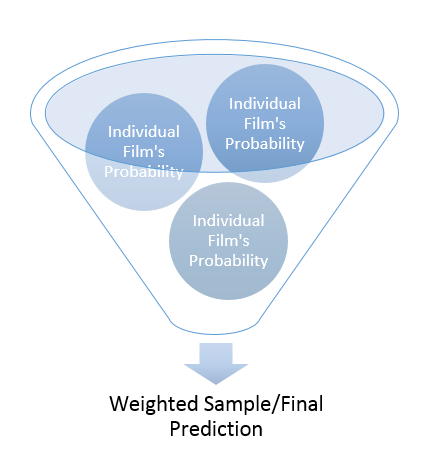
On average, and for the last ten years, Best Picture winners have a higher score than the mean of the all the nominees. There are two key aspects to our model: web scraping Wikipedia for film data and a combination of random forests and weighted samples for our predictions.
The actual predictions work in two steps. This is key for working with the vary number of nominations post-2009. First, the model calculates individual predictions using random forests. Then we take a weighted sample using the film's individual probability of winning. We then take the results of that sample as the set of probabilities for each film winning Best Picture.
Before using the model to predict this year's results, we tested it on past Best Picture races. To do this, we went year-to-year from 1990-2015. We predicted the winner of a specific year using all the data not from that year.
In retro testing, the model was able to successfully predict the winner 76.9% of time. Not to make excuses for the falsely predicted winners, but sometimes unusual circumstances do arise. We see this with the model predicting Brokeback Mountain, with a probability of 93.4%, losing to Crash, with a probability of winning at 3%. Crash, without doubt, is the most controversial winner of the last 25 years. Unfortunately, there is no way to account for the idiosyncrasies of a single year.
And last but not least, our full list of winning probabilities for Best Picture:
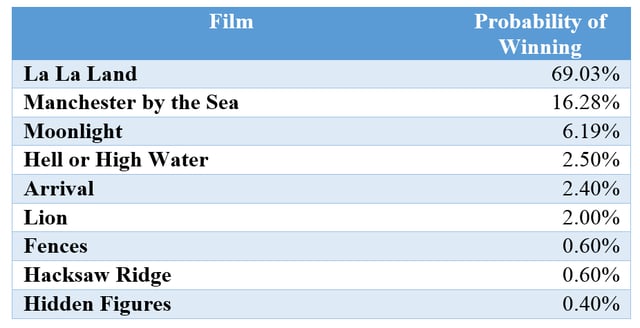
To no one’s surprise, La La Land comes out on top with a probability of winning at 69.03%. While Manchester by the Sea could pose some threat, it is La La Land’s award to lose at this moment.
We will all have to tune in this Sunday night to see if we predicted correctly!