December 9, 2020 •Corey West

In this two part pay equity blog series, Summit Consulting Senior Manager Corey West (who leads Summit's internal pay equity analyses) and Salt Hill's Alan Salzberg discuss the must haves for conducting comprehensive and reliable pay equity studies. The first post in the series was about three must-have elements for comprehensive, cost-effective pay equity assessments:. This second post is a brief case study of how to use data to analyze pay equity.
Pay is a function of several employee characteristics. How can we know if pay inequities are attributable to race, gender, or age? Here, Summit explains how to answer this question using regression modeling, predictive analytics, and statistical matching. As a Senior Manager with extensive experience in pay-equity analytics and a founding member of Summit’s Diversity Equity & Inclusion group, I lead the annual review of Summit’s internal salaries. Below, we take a closer look at each step of a pay-equity review.
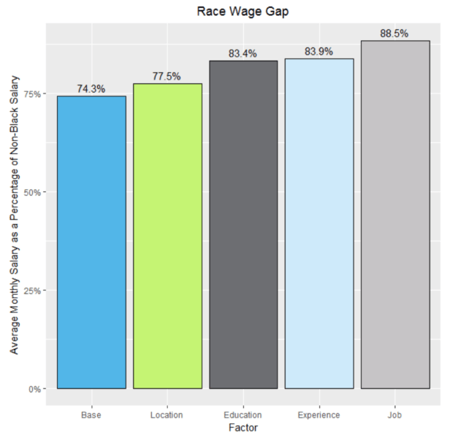
Regression modeling allows us to isolate the contribution and test the statistical significance for any one factor, such as race, to pay inequity. For example, suppose you have company data on employee salaries, locations, education, experience, and job titles. Before any regression modeling, you notice that Black wages are about 74% of non-Black wages. Is this evidence of race discrimination in pay? The short answer is no. We need to use a regression model.
As we start accounting for other factors that determine pay, our estimate of the race wage gap (74.3%) changes. In our data, we notice that:
Our regression model now reveals that Black wages are 88.5% of non-Black wages, not 74.3%. As in this example and others in our practice, regression models provide a much clearer picture of the pay inequity that is directly attributable to race.
We use predictive analytics to estimate employee wages given all characteristics except race. If the firm discriminates against Black employees, our model would overpredict Black wages and underpredict non-Black wages.
The figure below shows predictions from the company data. There are 120 Black employees and 815 non-Black employees.
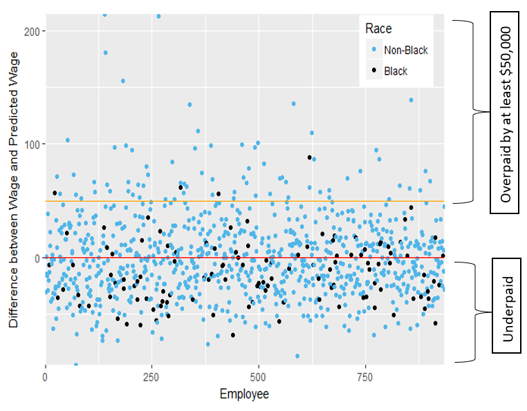
As shown in the figure above, there are 78 employees whose wages are at least $50,000 higher than the model predicts. Seventy-four of those employees (95%) are non-Black; four (5%) are Black.
The figure also shows that 65% of Black employees are below the red line. In other words, when taking into consideration the other characteristics of the Black employees (e.g., education, experience, etc.), the analysis suggests their wages at the company would be higher if they were not Black.
Statistical matching requires that employees be approximately equal in all characteristics before comparing their wages. While regression modeling provides precise pay-equity estimates for the firm collectively, statistical matching can be more reliable for subgroups within the firm.
Consider the table below. Match Group 1 produces two employees who live in the same place, have the same education, and have very similar experience and IQs. The non-Black employee earns $95,000 per year compared to $50,000 per year for the Black employee—a wage gap of $45,000 per year. We see similar wage gaps in Match Group 2 and Match Group 3.
| Match Group | Employee # | Race | Wage (in thousands of dollars per year) | Location | Education | Experience | IQ |
| 1 | 1 | Non-Black | 95 | North | 11 years | 13 years | 86 |
| 1 | 2 | Black | 50 | North | 11 years | 11 years | 74 |
| 2 | 3 | Non-Black | 121 | South | 12 years | 6 years | 95 |
| 2 | 4 | Black | 63 | South | 12 years | 6 years | 93 |
| 2 | 5 | Black | 64 | South | 12 years | 7 years | 96 |
| 3 | 6 | Black | 35 | South | 12 years | 7 years | 84 |
| 3 | 7 | Non-Black | 50 | South | 12 years | 6 years | 88 |
| 3 | 8 | Non-Black | 86 | South | 12 years | 6 years | 89 |
The combination of regression modeling, predictive analytics, and statistical matching ensures that we approach pay-equity analyses from every angle. Our findings represent comprehensive, statistically justified, and industry-current estimates of pay equity, and our analyses can be customized and extended to meet the needs of specific clients and their data. Here at Summit, we prioritize diversity, equity, and inclusion in our work and in how we treat our employees. Exploring and identifying potential sources of pay inequity is not only good for business, it’s the right thing to do. We are proud to have done this work for our clients and our own company and look forward to sharing our expertise with others.