Exploring Shifts in Insurance Products after ACA
April 19, 2016 •Heather Brotsos

 In this series of blog posts, we are using an All Payer Claims Database (APCD) from the state of New Hampshire to explore some questions related to the Affordable Care Act (ACA).
In last week’s blog post, we explored changes in wellness exams after the ACA. This week, we look into trends in insurance products. Has there been a shift over time? What differences can we observe in patient costs over time?
As health care costs rose over the last thirty years, efforts to contain costs drove a dramatic shift from indemnity plans to managed care plans. Through our claims analysis, we saw evidence of this shift in the commercial market.
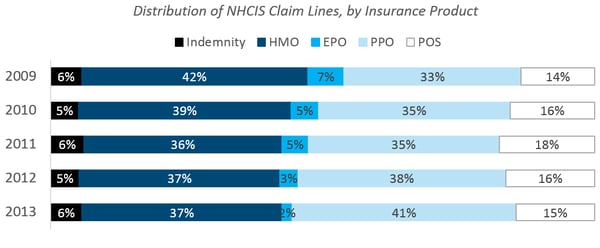
PPO Prevalence IncreaseD, EPO and HMO Prevalence DeclineD
Moving from top to bottom in the figure below, we observed that the prevalence of PPOs showed a marked increase, while EPOs and HMOs declined. Note that our data does not uniquely identify an individual, so our examination was limited to the volume of services provided. As a result, there may be differences in the number of services provided to an individual in one plan compared to another that cannot be distinguished here.

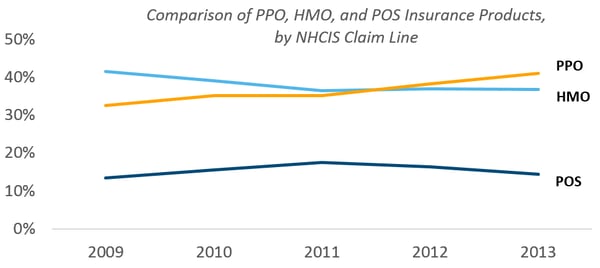
PPO BECAME More Popular than HMO
Looking at the three most prevalent insurance products, we saw PPO volume surpasse HMO volume around 2011. It’s unclear whether this trend will continue to widen the gap between HMO and PPO going forward.

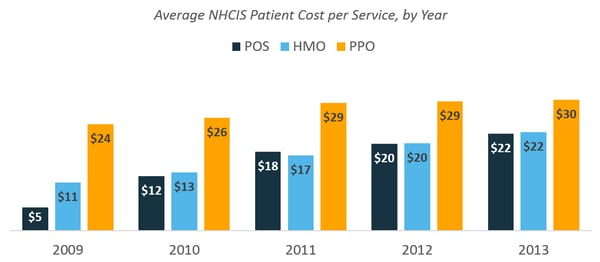
PPO ShowED Higher Average Cost per Service than HMO, POS
A comparison of patient costs by insurance product showed a higher average cost per service for PPO plans compared to HMO and POS plans. However, the difference narrowed over time due primarily to increasing deductibles for HMO and POS services.

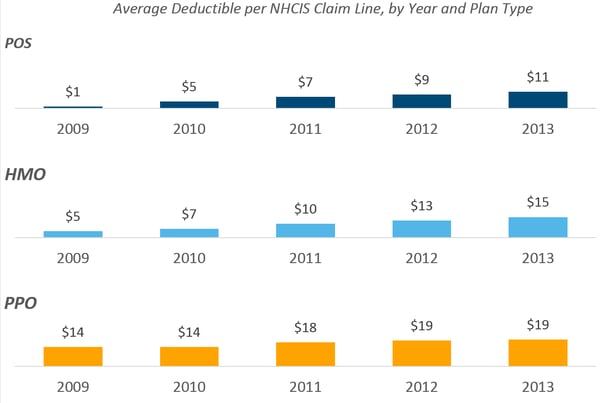
DeductIble Increases for PPO, POS, and HMO
In 2009, the average HMO deductible was about $5. Just four years later, it tripled to $15. This increase was even more extreme for POS plans, which rose from an average deductible of $1 in 2009 to $11 in 2013. In comparison, the average deductible with a PPO increased from $14 to $19.
Similar trends have been observed elsewhere. The 2015 Employer Health Benefits Survey identified an increasing trend in the average deductible among participants in employer-sponsored health plans. Additionally, the Peterson-Kaiser Health System Tracker observed an increase in annual deductible payments between 2004 and 2014 in an analysis of Truven Health Analytics MarketScan data.

what did we learn?
Through this project, we sought to understand what publicly available health claims data exists and to determine its value for analysis. We discovered that state APCD initiatives contribute greatly to the amount of data available. While each dataset has its own limitations, each also offers an opportunity to uncover new and exciting insights. We had fun exploring our research questions and observed some interesting trends in the data on preventive services and insurance coverage.
For more information about this health claims blog series or about Summit's data analysis services, contact Heather Brotsos.
For all figures above, data for analysis includes public use data set acquired from New Hampshire Comprehensive Health Care Information System.
Get Updates
Featured Articles
Categories
- affordable housing (12)
- agile (3)
- AI (4)
- budget (3)
- change management (1)
- climate resilience (5)
- cloud computing (2)
- company announcements (15)
- consumer protection (3)
- COVID-19 (7)
- data analytics (82)
- data science (1)
- executive branch (4)
- fair lending (13)
- federal credit (36)
- federal finance (7)
- federal loans (7)
- federal register (2)
- financial institutions (1)
- Form 5500 (5)
- grants (1)
- healthcare (17)
- impact investing (12)
- infrastructure (13)
- LIBOR (4)
- litigation (8)
- machine learning (2)
- mechanical turk (3)
- mission-oriented finance (7)
- modeling (9)
- mortgage finance (10)
- office culture (26)
- opioid crisis (5)
- Opportunity Finance Network (4)
- opportunity zones (12)
- partnership (15)
- pay equity (5)
- predictive analytics (15)
- press coverage (3)
- program and business modernization (7)
- program evaluation (29)
- racial and social justice (8)
- real estate (2)
- risk management (10)
- rural communities (9)
- series - loan monitoring and AI (4)
- series - transforming federal lending (3)
- strength in numbers series (9)
- summer interns (7)
- taxes (7)
- thought leadership (4)
- white paper (15)


