
May 5, 2023 •Corey West
With contributions by Brigid Cummings and Ashley Lucero
As a follow-up to our live webinar published last week, the team at Summit Consulting is determined to quantify the impact of investor involvement on the origination of loans for owner-occupied loan applicants. The analysis performed below on Duval County, Florida, is in accordance with Summit’s previous fair lending analyses that accounted for the borrower’s creditworthiness, protected class status (i.e., race and ethnicity), and concentration of minority residents in the borrowers’ census tract. Duval County includes the city of Jacksonville.
To begin, we constructed a dataset of purchase mortgages from 2018 to 2021 using data from the publicly available Home Mortgage Disclosure Act (HMDA) dataset with standard data trimming of key variables (that is, removing observations with missing variables and retaining the inner 98% of continuous variable distributions). Also, for a census tract to be included, it must have at least 30 purchase loan applications in a given year. We then performed the following analyses on data from Duval County:
As Table 1 below shows, an average of roughly 5% of purchase loan applications in a census tract are for non-owner-occupied properties. More specifically, approximately 3.6% (25 out of 690) of the census tracts and activity year observations have 0% of investment loan applications. In contrast, approximately 14% (96 out of 690) of the census tracts and year combinations have investment applications accounting for more than 40% of all applications.
| Minimum | Median | Mean | Maximum |
| 0.00% | 4.60% | 5.63% | 47.06% |
Source: HMDA dataset.
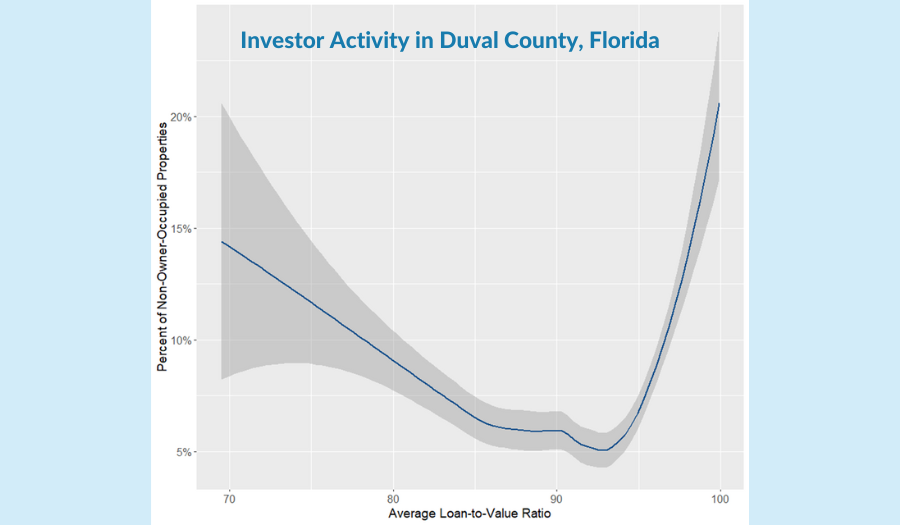
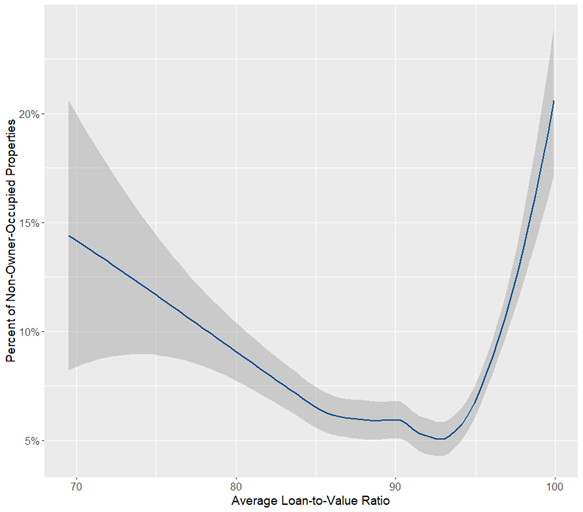
Summit first investigated the relationship between financial risk characteristics and the level of investment activity within census tracts. Figure 1 below shows how this investment activity changes in relation to the average loan-to-value (LTV) ratio in a census tract. For census tracts with an average LTV below 90, the investment activity tends to decline as LTV increases. However, investment activity spikes in riskier census tracts with LTVs above 90.
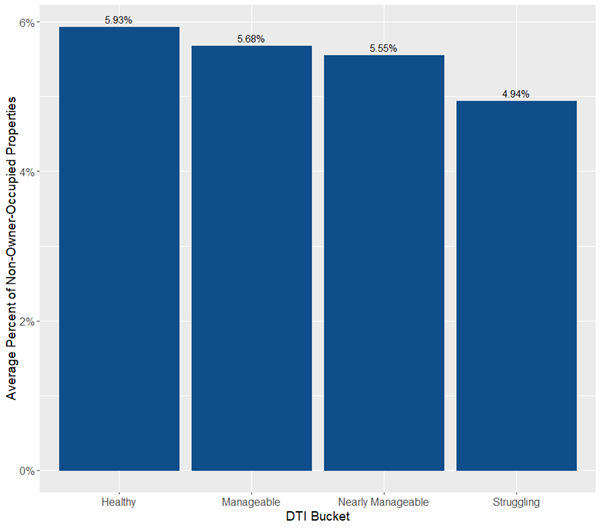
The chart in Figure 2 below shows the average investment activity in each debt-to-income (DTI) ratio bucket. Investment activity is most prevalent in census tracts with the healthiest DTI ratios and shows a slight steady decline as DTI ratios become riskier. The bucketing of DTI ratios is consistent with the work performed by The Markup.
The DTI ratio buckets are defined as follows:
Based on the two descriptive analyses above, we see that investment activity is present in a range of communities, from the riskiest of LTVs to the healthiest of DTI ratios. To better understand how this activity is affecting loan applicants looking to purchase owner-occupied properties, we performed a regression analysis.
For this analysis, we executed a logistic regression to determine the relationship between loan origination for owner-occupied properties and census-level investor activity, controlling for financial risk and demographic factors. The controls in this regression included loan type (e.g., conventional), loan amount, borrower’s income, borrower’s LTV ratio, borrower’s DTI ratio bucket, borrower’s race and ethnicity, and the minority makeup of the census tract.
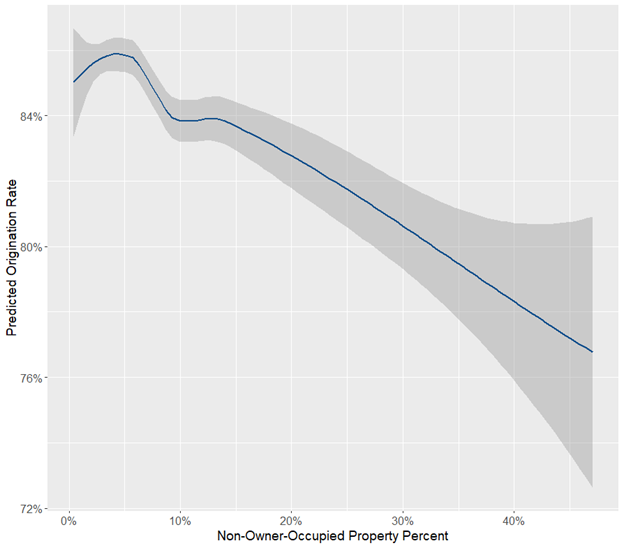
The graph in Figure 3 below shows that controlling for the factors above, predicted loan originations decrease as the percentage of loan applications for non-owner-occupied properties increases in a census tract. This relationship is statistically significant at the 5% level.
Borrowers in Duval County, Florida, are experiencing an additional hurdle to secure funding for purchasing homes in census tracts with relatively higher investor involvement. As illustrated, the additional hurdle exists even when considering a borrower’s creditworthiness and protected class status.
Summit’s next steps include expanding to additional counties in the United States and refining the analysis—stay tuned!