
August 21, 2015 •Melissa Cichantek
* Welcome to the fifth (and final) post in Summit's 2015 Summer Intern Series! See below for Summer Analyst Bradley Rava's essay. Click here to learn more about our Summer Analyst/Associate program. *
The human brain is especially skilled at extracting information from visual data. However, it is limited to doing this in three or fewer dimensions—and many of our everyday challenges have more than three dimensions. For example, our career choices take into account a wide variety of variables: our interests, our abilities, where we want to live, the employment market, and more. How can we visualize problems that involve many dimensions? This is the question that topological data analysis (TDA) seeks to answer. Every data set has an inherent structure that can be expressed through a visualization, and this visualization can give us insight to the information contained within it.
Theory in Topology
TDA is a method of learning from and visualizing data that is rooted in mathematical topology. Topology is the study of objects under continuous deformations–that is, objects changing from one shape to another–with the exception that one cannot tear, cut, or glue throughout this deformation. It helps to imagine that your object is made out of playdough. For example, a cube is topologically equivalent to a cylinder, because you could squish the cube into the shape of a cylinder without tearing, cutting, or gluing any pieces.

However, things become complicated when we try to prove that two objects cannot be deformed into one another (since being unable to discover a deformation does not disprove its existence). In order to distinguish objects, we use a tool known as a topological invariant: a property of an object that remains true to an object even if it is continuously deformed. One classic invariant is the number of holes an object has. Using that property, we can easily prove that a cube is not topologically a doughnut (or a torus) because one would have to cut a hole in the cube in order to obtain a doughnut shape.

What Questions can TDA Answer?
Topology is extremely good at creating low-dimensional representations of high-dimensional data–that is, capturing the important characteristics of the data in a few composite variables that we can graph–and at the same time in finding groups within the data and how they relate to each other.
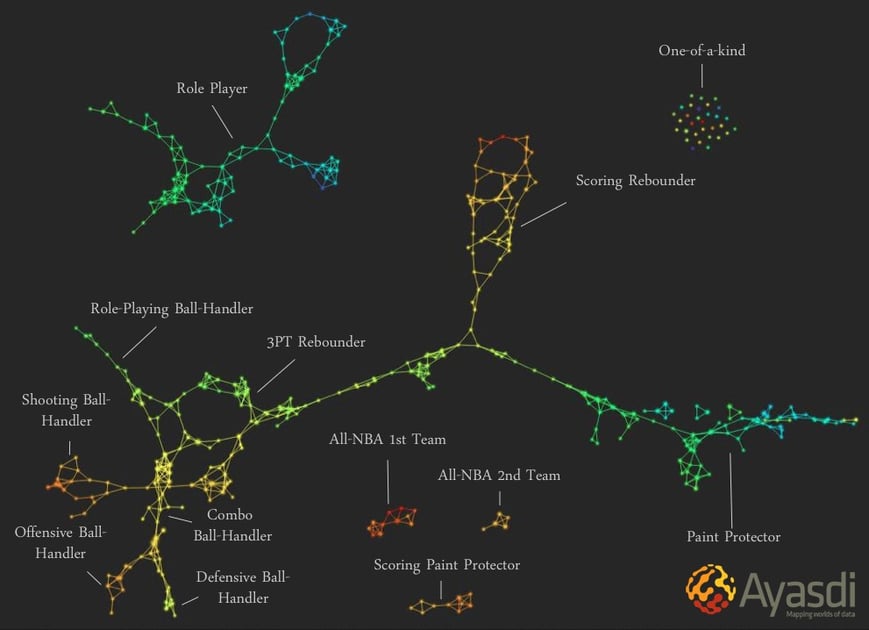
These powerful representations allows data scientists to see groups in their data without knowing about those groups in advance. Further, it illustrates how groups are connected. For example, TDA has been used to determine how different playing styles in basketball influence ones position. Consider this image, used with permission from Ayasdi:
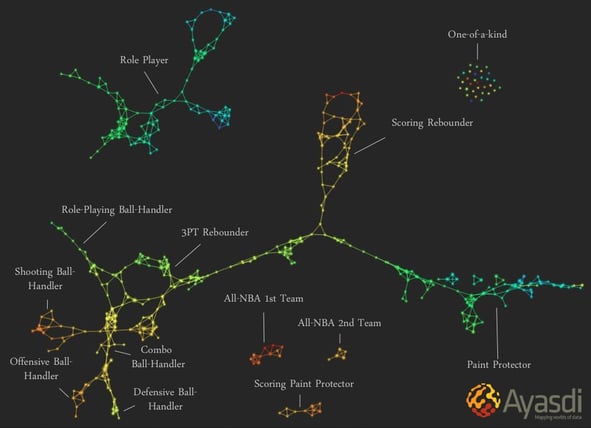
What makes the above visualization so meaningful is that not only answers the question of how players are given specific positions, but it is also able to show us information about the data that we did not know before. For example, the visualization suggests that basketball is much more complicated than its traditionally perceived 5-position model. In fact, Topological Data Analysis shows us that there exist at least 12 positions in basketball. It is this type of insight that makes TDA so useful, since it helps us see underlying information in data that we otherwise would have missed.
How does it work?
In a TDA visualization, information is typically represented as a graph of nodes where the size of each node and the distance between them have significance. We build these using a combination of a distance metric (how far apart the nodes are from one another), a lens filter (the trait being measured), and node density (how strongly each variable exhibits the trait being analyzed). This combination of metrics allows us a unique and intricate perspective on the data we are analyzing.
This may sound complicated—but there’s an easy way to start. Follow this link to download a set of user-friendly tools for getting started with topological data analysis in R.
Data visualization is a powerful tool in data mining and TDA can help us discover hidden information contained in a dataset. It is a beautiful marriage of mathematics and data mining that will undoubtedly become more important as data becomes more complicated. The better we understand the shape of our data, the better we understand the data itself.
References
Ayasdi, Inc. "Using Topological Data Analysis for Sports Analytics." Accessed August 20, 2015. http://www.ayasdi.com/wp-content/uploads/_downloads/Redefining_Basketball_Through_Topological_Data_Analysis.pdf.