
April 16, 2015 •Kevin Danielson

 Arguably, writing a blog post of a blog post could be considered derivative. But to be fair, this analysis only concerns the second footnote on the sixth slide of a report written by a third party commissioned by the organization hosting the blog. Is it still considered derivative? Probably. Here’s some background before you decide.
The organization, PeopleforBikes™, is a 16 year old coalition of individuals and businesses for the advocacy of national bicycling. One of this organization’s efforts is data collection on bicycle statistics, in particular, researching how to measure bicycle participation in cities across the U.S. The goal of this research is to inform local infrastructure decisions as they relate to transportation, namely bicycles.
Michael Andersen’s March 12th PeopleforBikes™ post, “Here are the First-Ever National Findings about ‘Interested but Concerned’ Bikers”, cites the first report on this research, as well as what appears to be a photo of a vintage 1973 VW 181. Full of (potentially) informative statistics, this report acknowledges a challenging problem endemic to subjective questionnaire research, and footnotes the chosen remedy.
On slide six of U.S. Bicycling Participation Benchmarking Study Report, the authors at Breakaway Research Group acknowledge the problem of response bias. Defined as “a systematic tendency to respond to a range of questionnaire items on some basis other than the specific item content”, respondents may broadly exhibit this bias in two categories (Paulhus, 1991). When a respondent reacts to situational factors (such as time) by distorting responses, the bias is known as response set. If the respondent exhibits consistent distortions across time or situations, the bias is known as response style. These two categories may be further characterized by forms of response distortion such as socially desirable responding, acquiescence, and extremity bias (Paulhus, 1991). For this analysis, it is sufficient to acknowledge response bias as a material issue resulting in consciously or unconsciously altered survey results. The category of response bias is not a concern.
In order to acknowledge materiality, how does one identify and reduce response bias? The answer (if there was one) may not be so obvious. Breakaway Research Group’s approach is twofold: question randomization and respondent deception. Their survey includes a series of questions about 10 different activity participations. These activities are randomized such that they do not appear in a conscious order (U.S. Bicycling Participation Study, 2014). This approach is an often proposed method for reducing response bias, similar to reversing the scale of measured attribute response ranking (e.g. Tibbles, Waalen, & Hains, 1998). While this approach may reduce response bias, it does little to identify it.
Breakaway Research Group’s second approach is a more innovative attempt to identify and reduce response bias: the survey includes a deceptive question asking respondents if they had visited a fake “YLR” website (U.S. Bicycling Participation Study, 2014). A quick Google search of “YLR website” primarily returns links for Yes Lord Radio. Those who actually listen to National Gospel Music Radio notwithstanding, Breakaway Research Group assumes a “yes” response to this question indicates response bias. 58% of “yes” respondents to this fake question also respond “yes” to all participation questions (U.S. Bicycling Participation Benchmarking Study Report, 2015). Conversely, 5% of “no” respondents to the fake question also respond “yes” to all participation questions (U.S. Bicycling Participation Benchmarking Study Report, 2015). Breakaway Research Group asserts the relatively higher share of “yes” to “no” responses signal that false respondents exhibit response bias. These false respondents are therefore excluded from the population.
For these results to be indicative of response bias, respondents must either be distorting answers or flat copying their previous answers for convenience (Gamliel and Peer, 2011). It is not clear if the latter situation were possible—all participation questions would have to be present on the screen at the time of response. The methodology and questionnaire information provided by PeopleForBikes™ is not sufficient to determine.
On the surface, this deception approach seems reasonable. False responses to a trick question should signal biased data. But how strong is Breakaway Research Group’s measure of this bias? 58% is greater than 5%, but is this comparison sufficient to justify excluding respondents? It is unclear if respondents did not know or misunderstood “YLR website,” creating false positives. As it happens, Cronbach’s coefficient alpha, “…an estimate of the correlation between two random samples of items from a universe of items like those in the test,” can be used as a reliability measure for internal consistency in dichotomous or scaled response questionnaires (Schmidt, Le, & Ilies, 2003). Literally,
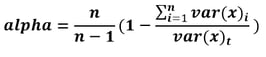
where n is the number of items, x is the item, var(x)i is the variance of item i = 1 to n, and var(x)t is the variance of the total score (Cronbach, 1951, p. 299). The structure of this coefficient is such that as internal consistency (reliability) increases, so does Cronbach’s coefficient alpha. A value of 1 indicates perfect correlation among items.
Had Breakaway Research Group applied Cronbach’s coefficient alpha to subsets of their questionnaire results, they might have better quantified the different respondents. For example, if the coefficient alpha of the 58% population were greater than the 5% population (or total population), Breakaway Research Group could apply tests of significance to determine if the internal consistency were statistically significant. Hakstian & Whalen’s (1976) test of the difference between independent Cronbach’s alpha coefficients is one such possibility for confirming significance of higher relative internal consistency (Gamliel & Peer, 2011).
Without stronger evidence supporting Breakaway Research Group’s exclusion of the erroneous responses, the report findings can still be assumed biased. The excluded population may not actually exhibit response bias. Conversely, the excluded population may actually exhibit response bias but so may another included population. In either case, the U.S. Bicycling Participation Benchmarking Study Report findings would be flawed due to arbitrary inclusion of responses.
It is possible Breakaway Research Group calculated Cronbach’s coefficient alpha (or performed similar research) and did not include the results in the report. Even if this calculation were not performed, PeopleforBikes™ could still do so, assuming the data were available. Reviewing this measure for different subsets of responders would validate Breakaway Research Group’s approach. PeopleforBikes™ could then determine where their bicycle participation research falls short and how to improve.
Regardless of how the U.S. Bicycling Participation Benchmarking Study Report results shake out, Breakaway Research Group champions a unique approach to response bias. In conjunction with question randomization, reverse scaling, and obscured responses, deceptive questioning could prove to be a beneficial tool for correcting response bias. It will be encouraging to see this technique successfully implemented in other questionnaire research.
This post was written with the help of Dr. Eddie Seiler.

References
Andersen, M. (2015). Here are the first-ever national findings about ‘interested but concerned’ bikers. PeopleforBikes. Available online: http://www.peopleforbikes.org/blog/entry/here-are-the-first-ever-national-findings-about-interested-but-concerned-bi.
Breakaway Research Group. (2014). U.S. Bicycling Participation Benchmarking Study. Available online: http://b.3cdn.net/bikes/556493fe0473f804e1_erm6ivf9y.pdf.
Breakaway Research Group. (2015). U.S. Bicycling Participation Benchmarking Study Report. Available online: http://www.peopleforbikes.org/pages/u.s.-bicycling-participation-benchmarking-report.
Cronbach, L. J. (1951). Coefficient alpha and the internal structure of tests. Psychometrika, 16, 297-334.
Gamliel, E., & Davidovitz, L. (2005). Online versus traditional teaching evaluation: Mode can matter. Assessment and Evaluation in Higher Education, 30(6), 581-592.
Gamliel, E., & Peer, E. (2011). Too Reliable to be true? Response bias as a potential source of inflation in paper-and-pencil questionnaire reliability. Practical Assessment, Research & Evaluation, 16(9). Available online: http://pareonline.net/getvn.asp?v=16&n=9.
Hakstian, R.A., & Whalen, T.E. (1976), A k-sample significance test for independent alpha coefficients, Psychometrika, 41, 219-231.
Paulhus, D.L. (1991). Measurement and control of response bias. In: J. P. Robinson, P. R. Shaver, & L. S. Wrightsman (Eds.), Measures of Personality and Social Psychological Attitudes (pp. 17-59). San Diego, CA: Academic Press.
Schmidt, F. L., Le, H., & Ilies, R. (2003). Beyond alpha: An empirical examination of the effects of different sources of measurement error on reliability estimates for measures of individual differences constructs. Psychological Methods, 8(2), 206-224.
Tibbles, A. C., Waalen, J. K. & Hains, F. (1998). Response set bias, internal consistency and construct validity of the Oswestry Low Back Pain Disability Questionnaire. Journal of Canadian Chiropractic Association, 42(3), 141-149.