
August 21, 2018 •Anoushka Patel

Tree-based modeling is an excellent alternative to linear regression analysis. But what makes it so advantageous? Tree-based models:
There are two types of tree-based models: regression and classification. A regression tree is used for a continuous dependent variable, such as calories in cereal, and a classification tree is used for a categorical dependent variable, such as manufacturer of cereal.
Decision trees split from the top down, grouping data into the most homogeneous “sub-nodes” based on their characteristics. While the algorithms vary based on the type of tree, the goal is to split the data so that the sub-nodes are as uniform as possible. This process can continue until the splits result in one “leaf” per observation. However this may result in few data points and a model that is not very useful. You can end a decision tree by either (1) setting a constraint to indicate when splitting should be complete or (2) “pruning,” which gets rid of sub-nodes that hold little statistical power.
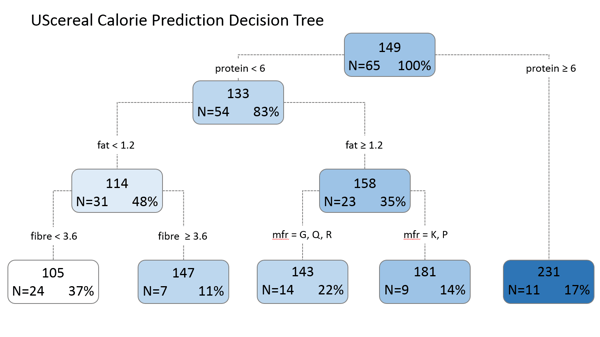
We created a decision tree using UScereal data from the MASS package in R, which includes information on types of cereals and their nutritional content. For this model we use the variables protein, fat, fiber, carbohydrates, and manufacturer to predict the number of calories in cereal.
A test for normality, the Shapiro-Wilk test, shows that these data are not normal. However, this does not violate any assumptions for the decision tree or affect interpretation of results, illustrating a key advantage of tree-based models.
In this visualization, the first split is the protein amount at the value of 6. This shows that cereals with a protein content of 6 grams or more have the highest levels of calories. For cereals with a protein content of less than 6 grams, additional factors such as fat, fiber, and carbohydrates also contribute to total calories, with fat having the most influence. These additional sub-divisions can be observed in the sub-nodes of the tree.
More complex tree-based models, such as random forests and boosted trees, incorporate multiple decision trees. Random forests combine the results from multiple decision trees to create a single model with a more accurate estimate. Boosted trees create simple, binary trees that are built from the preceding tree, eventually resulting in a good fit between the independent and dependent variables. Decision trees are merely one building block for creating more accurate predictive models.
6.5.1. What do we mean by "Normal" data? (n.d.). Retrieved from Engineering Statistics Handbook: https://www.itl.nist.gov/div898/handbook/pmc/section5/pmc51.htm
Analytics Vidhya Content Team. (2016, April 12). A Complete Tutorial on Tree Based Modeling from Scratch (in R & Python) . Retrieved from Analytics Vidhya: https://www.analyticsvidhya.com/blog/2016/04/complete-tutorial-tree-based-modeling-scratch-in-python/#two
Deshpande, B. (2011, July 12). 4 key advantages of using decision trees for predictive analytics. Retrieved from Simafore: http://www.simafore.com/blog/bid/62333/4-key-advantages-of-using-decision-trees-for-predictive-analytics
Introduction to Boosting Trees for Regression and Classification. (n.d.). Retrieved from TIBCO Software: http://www.statsoft.com/Textbook/Boosting-Trees-Regression-Classification
Koehrsen, W. (2017, December 27). Random Forest Simple Explanation. Retrieved from Medium: https://medium.com/@williamkoehrsen/random-forest-simple-explanation-377895a60d2d
What do we mean by "normal" data? (n.d.). Retrieved from Engineering Statistics Handbook: https://www.itl.nist.gov/div898/handbook/pmc/section5/pmc51.htm